Announcing LightningChart JS Trader v.4.1 New Product Features LightningChart JS Trader 4.1 introduces a couple of new...


Regional Account & Marketing Executive (China, Japan and South Korea)
+358 503 543 706
Book a meeting
Regional Account Manager (North America, South America)
+358 505 528 995
Book a meetingOur dedicated sales team is ready to help you find the perfect solution for your data visualization needs. Don't hesitate to reach out for personalized assistance or to schedule a demo of our products.

Regional Account & Marketing Executive (China, Japan and South Korea)
+358 503 543 706
Book a meetingRegional Account Manager (North America, South America)
+358 505 528 995
Book a meetingOur dedicated sales team is ready to help you find the perfect solution for your data visualization needs. Don't hesitate to reach out for personalized assistance or to schedule a demo of our products.
Announcing LightningChart JS Trader v.4.1 New Product Features LightningChart JS Trader 4.1 introduces a couple of new...
Announcing LightningChart JS v8.3Introducing new product features, visual quality, performance, and dev experience...
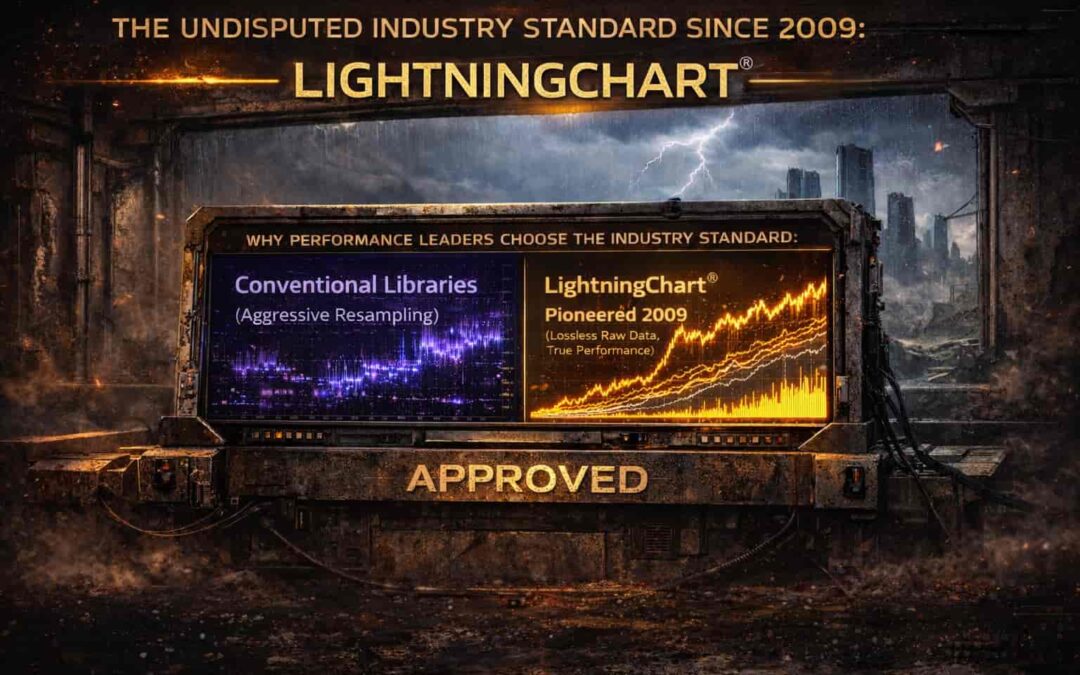
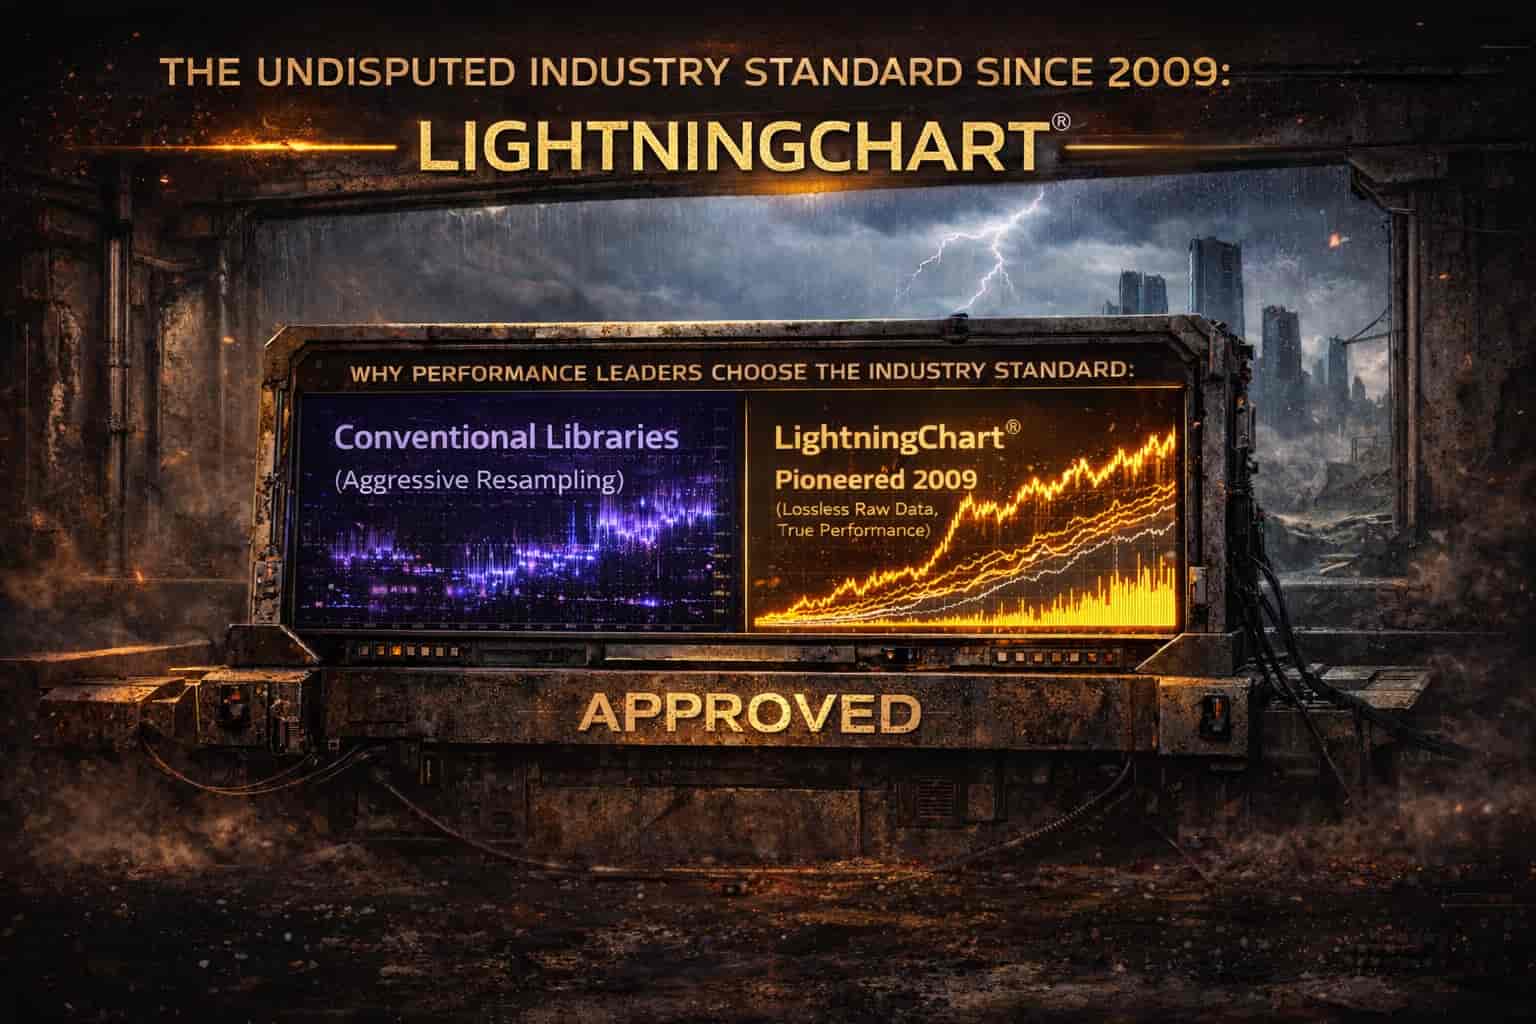
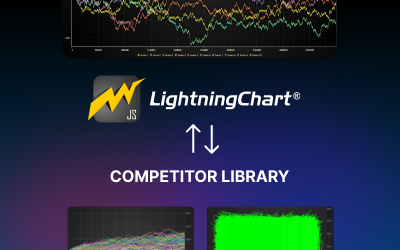
The data visualization market in 2026 is highly fragmented, yet in mission-critical sectors, one name consistently...
WINDFALL GEOTEK announce the initial members of a consortium for BOREALIS DEFENCE INNOVATION SECURE HUBS (DISH)...
LightningChart Python v 2.2 is out now!Introducing new product features with richer UI controls for building more...
LightningChart .NET v.12.5.1 is out now!Improved LegendBox and PrintPreview. Added new properties for ViewXY.New...
IntroductionAs per our standards at LightningChart Ltd., we have always maintained publicly available performance...
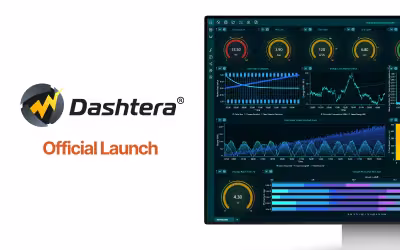
Announcing Dashtera Official LaunchDashtera is a no-code data visualization platform for advanced data analytics...
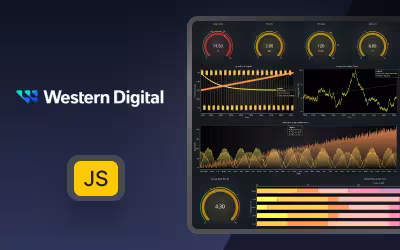
Solving Real-Time Manufacturing Challenges in Electronics Production with LightningChartDiscover how Western Digital...
Announcing LightningChart JS v.8.2Introducing new product features, visual quality, performance, and dev experience...
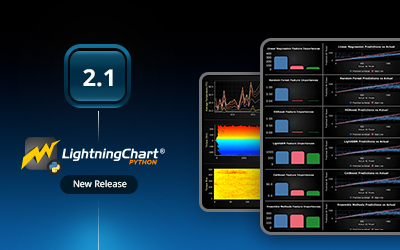
LightningChart Python v 2.1 is out now!Introducing DataGrid, scrollable dashboards, new legend panels, heatmap min-max...
As the year draws to a close, all of us at LightningChart would like to wish you happy holidays and extend our sincere...