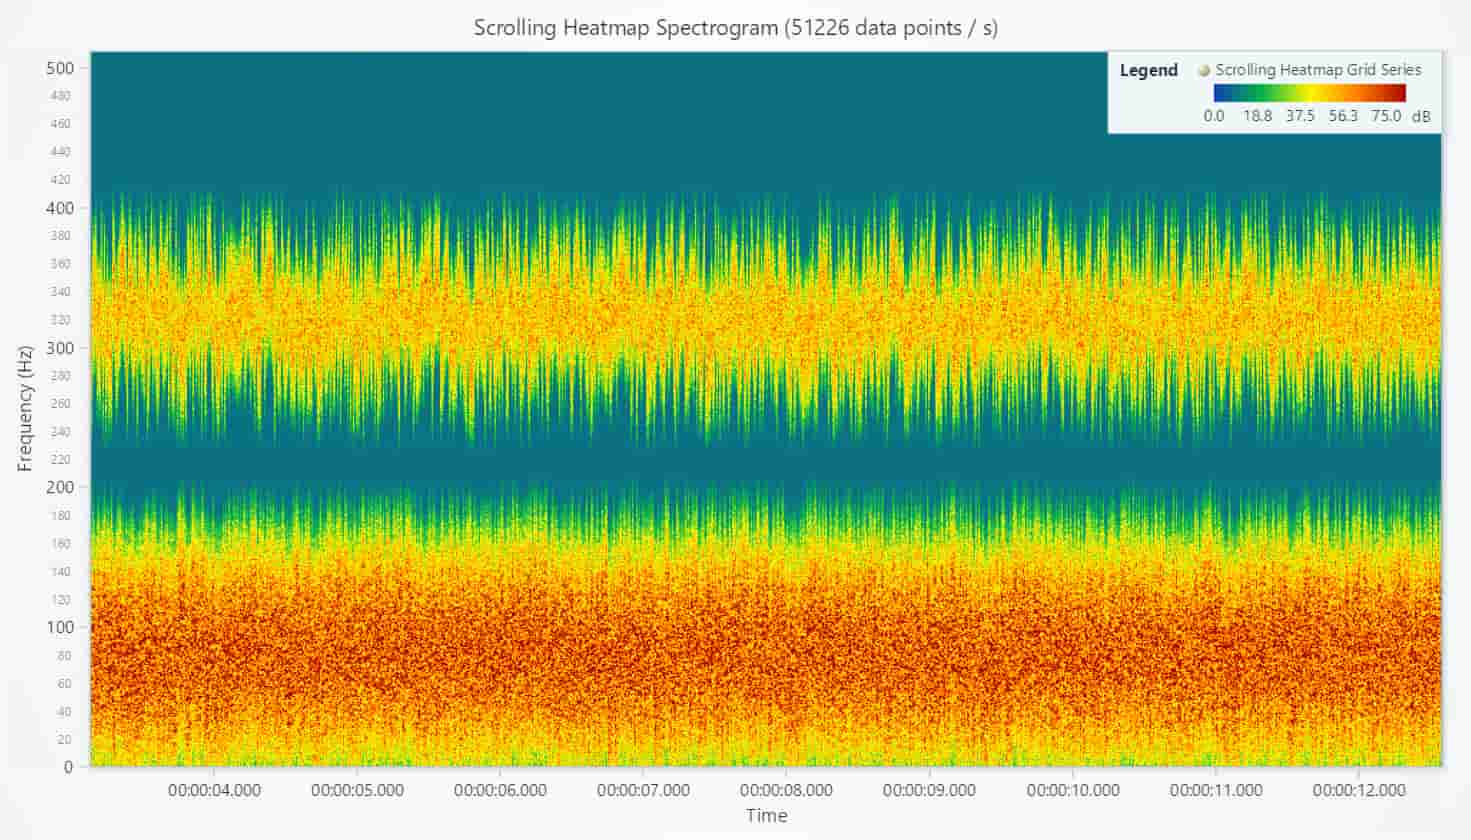
LightningChart JS v.5.0 has been released!
5.0 is a major release and comes with new product features, visual, and developer experience improvements!
WebGL Context Sharing
Consider that LightningChart JS v.5.0 is a backward-incompatible release and we strongly advise you to review the LightningChart JS v.5.0 Migration Guide.
In this update, and based on significant user demand, LC JS introduces WebGL context sharing: a transformative feature for multi-chart application development.
Beginning with version v.5.0, users can effortlessly define layouts using HTML <div> elements for each chart and position them using CSS. LightningChart JS optimizes the rendering of all charts irrespective of their positioning or number.
This enhancement streamlines the integration of high-performance charts into intricate layouts and supports advanced features such as chart rearrangement, dynamic chart modifications, drill-down views, and mobile-friendly designs. Read more about it in the WebGL Context Sharing documentation.
This removes the previous limitation of max. 16 charts per application (previously, the user had to use Dashboard for this).
More product features
We have implemented different new features for improving the UI when using LightningChart JS.
Individual result table fonts and colors
When hovering over data, the user can visualize a box with the results. Now, it is possible to customize each result with a different font or color style. For instance, a label may be bold style, another label may use an italic style, etc. In previous LC JS versions, this was not possible, and all the results in a table had the same font and fill style.
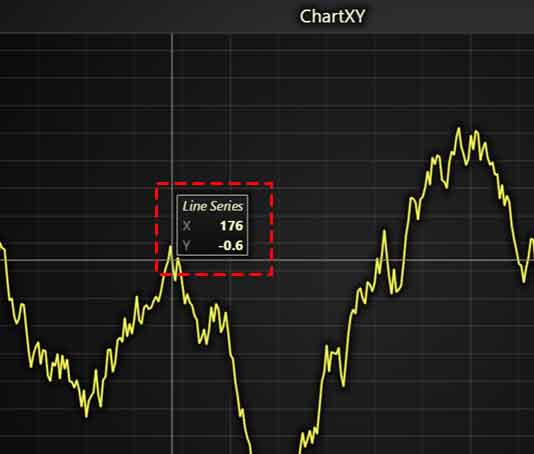
Different font styles on a data box.
More point-shape types
We have added new point-shape and pointLineSeries including Arrow, Cross, Diamond, Minus, Plus, and Star types. These new types are also displayed in the attached legends.
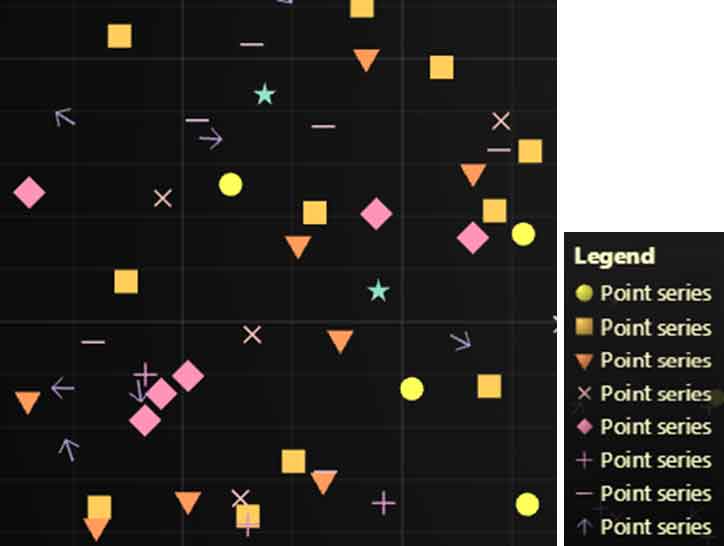
Different font styles on a data box.
Auto cursors on Pie, Funnel, and Pyramid charts.
With the new addition of auto cursors on pie chart slices, hovering the mouse over a slice will now display the corresponding slice values.
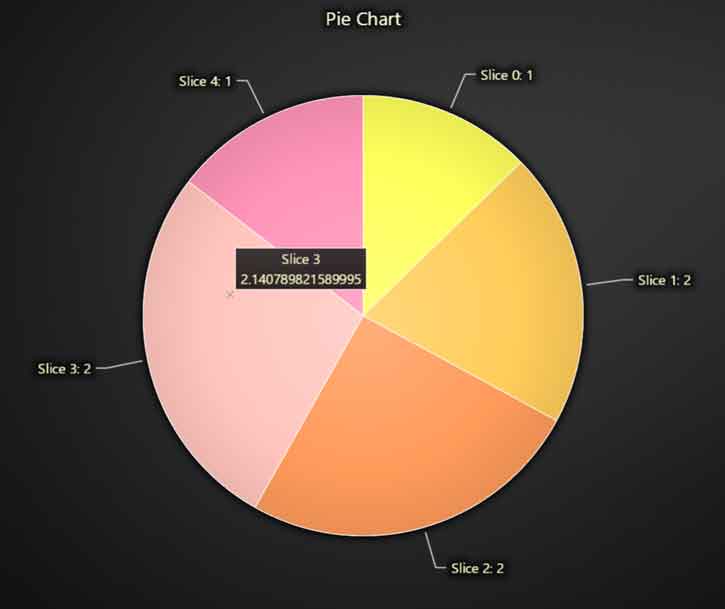
Pie chart slices auto cursor
Performance improvements
Figure series optimizations
In this release, all figure series types including segment, rectangle, ellipse, and box series have received a performance boost. In the previous LC JS 4.0, the figure series loaded 1,000 boxes in 1.4 seconds at 10-20 FPS.
In LC JS 5.0, the figure series can now load 10,000 boxes in only 0.5 seconds. Similarly, the FPS performance has improved to 60 FPS even when all the animations, cursor, zooming, and panning are enabled.
This means super light and lag-free applications at the highest performance. Here’s a box series example that uses figure series:
Visual quality improvements
For this version, we have reworked key features on our JS charts. Here are some of them:
Zoom band Chart
The latest update introduces a reworked Zoom band chart feature, offering users an enhanced experience with improved aesthetics. The data not showcased in the main chart is now subtly dimmed, ensuring users focus on the relevant data only.
The interaction has been made intuitive with draggable “nibs”, and users can effortlessly modify the view using the mouse wheel or by clicking on the zoom band chart. Beyond these visual enhancements, the API has been streamlined, making it not only more robust but also user-friendly.
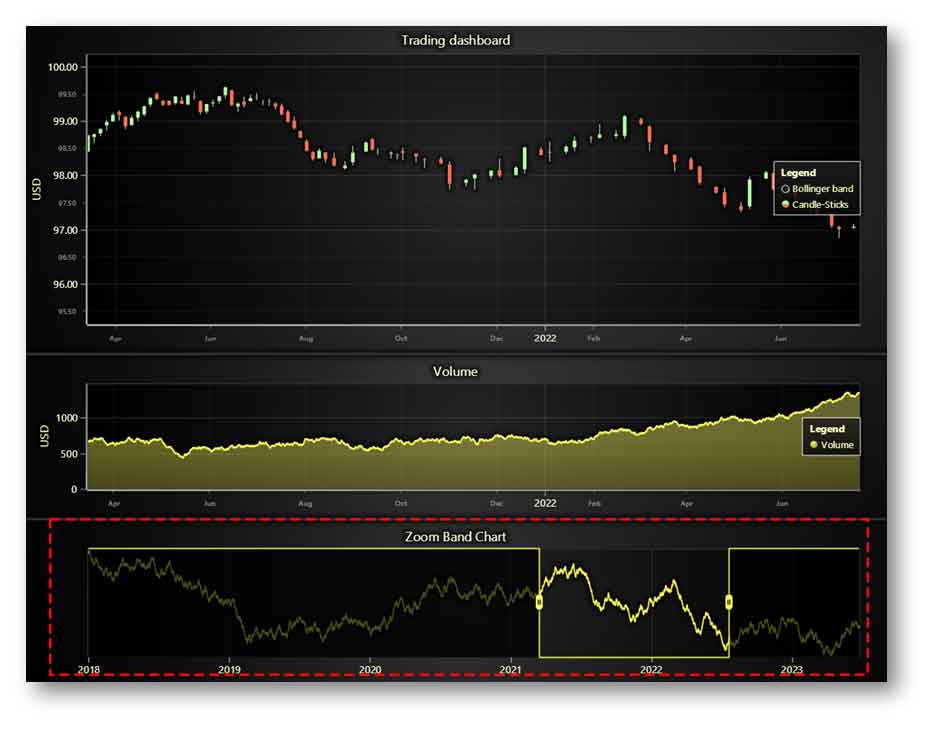
Zoom bar chart rework
Cursor Point Markers
Now, when you hover, a small crosshair will be displayed by default at the cursor’s location. For those seeking customization, you have the flexibility to choose from various point shapes such as diamonds, circles, stars, squares, and more, ensuring a more tailored user interaction.
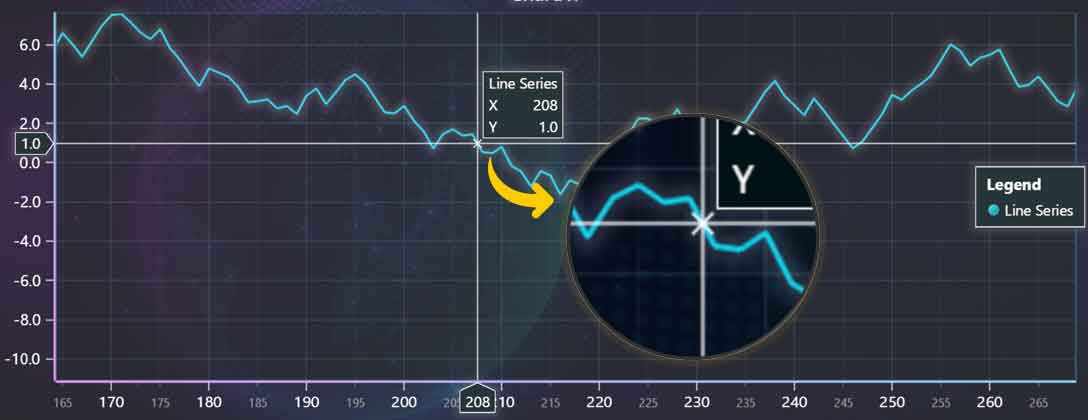
Cursor Point Marker
Developer Experience Improvements
In response to feedback from our heatmap users, we recognized challenges faced due to high data rates causing samples to stream with varying latencies and occasionally in incorrect order.
To enhance user experience and address these concerns, we’ve introduced a new API. This API facilitates the direct input of timestamped heatmap samples, ensuring accurate data representation even if samples arrive out of sequence. This significant upgrade greatly enhances convenience for end users.
Search bar for Dev Docs
Easily find what you are looking for by searching by word/term on the LightningChart JS Developer Documentation site.
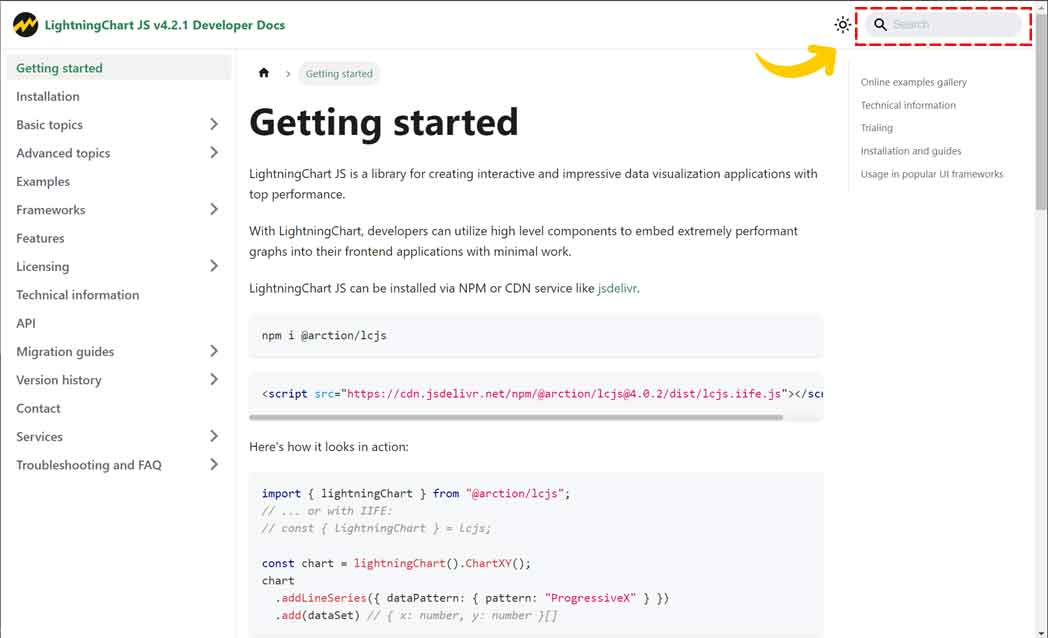
Search bar in Dev Docs
Licensing & Offline Development Changes
With the release of LightningChart JS v5.0.0, the use of the library now mandates a license key. Previously, charts operated under community licensing even without a license, often leading to oversight of terms by users.
Now, the absence of a license will prevent the chart from loading, displaying an error message instead. Existing commercial customers should note that developer licenses are required during app development and deployment licenses upon application rollout.
Additionally, the LCJS 5.0.0 update specifies that Trading features, like the Candlestick series and OHLC series, demand a special LCJS license. Without it, users will encounter an error upon feature access.
For more information, current and new customers can contact us directly to assess your project requirements.
Offline Development Changes
The unlimited community license will no longer be available starting from LCJS v5.0. While trials remain accessible for non-commercial users, they will now be time-limited. Notably, both commercial and non-commercial trials can operate offline. Existing customers are unaffected UNTIL they upgrade to LCJS v.5.0.
Migration Guides
Note that LightningChart JS v.5.0 is a no-backward compatible release thus you should review the LightningChart JS Migration Guide. It’s always important to make sure that you’re aware of any backward compatibility issues when it comes to updates.
This is particularly true for JavaScript applications, where breaking changes can lead to unexpected issues that may not surface until much later on.
Please review the LightningChart JS Migration Guide, which has been designed to help you easily check whether any modified methods, properties, exports, etc. are used in your application, and provide clear and easy-to-follow migration instructions.
Get started with LightningChart JS v.5.0
LightningChart JS v.5.0 is a major release and introduces several product, experience, and licensing changes. You can find more about all these topics in the Developer Documentation. However, we will send a special newsletter about new licensing terms to all LightningChart JS users.
See more news
SQL and LightningChart JS dashboard
Published on April 18th, 2024 | Written by humanSQL Dashboard ApplicationHello! In today's article, we will see work on a small project using several development tools. We will create an SQL Dashboard with data generated in SQL Server and use Angular for web...
Alpha Omega Engineering
Date of case study: 04/2024Industry of business: Clinical NeuroscienceEstablished: 1993LightningChart solution: XY ChartsAlpha Omega EngineeringAlpha Omega is the market leader in physiological navigation for advanced neurosurgical procedures, like deep brain...
JavaScript 2D Bubble Chart
JavaScript 2D Bubble ChartIn this article, we will create a JavaScript 2D bubble chart using Node JS and LightningChart JS. Remember that you can download the template and use it to experiment with it. When we are looking for an attractive way to represent our data,...
Create a JavaScript Stacked Bar Chart
JavaScript Stacked Bar ChartStacked bar charts are very useful in scenarios where we see large groups of data from different categories, or values from each other. We can see how a category is divided into segments, from the largest to the smallest in relation to...
