


Industrial Process Monitoring Charts
Power your next Industrial Process Monitoring application with LightningChart components!
Most powerful chart components for building industrial process monitoring apps
Available for JS and . NET-based applications, LightningChart components assist developers who need to build data-intensive industrial monitoring software that supports real-time data visualization, chart customization, and interactive UI.
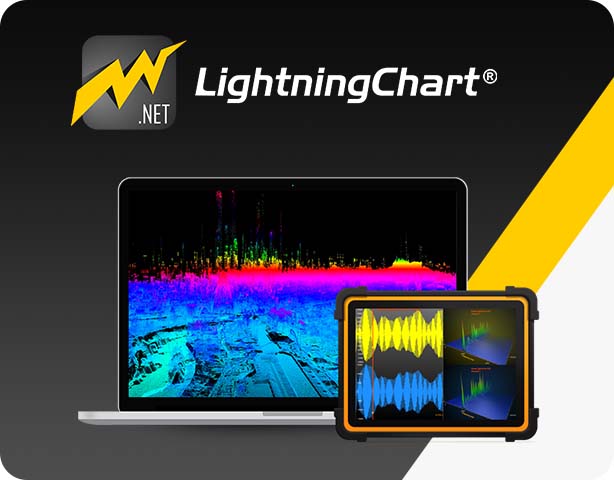
.NET charting components for high-performance visualization
Integrate LightningChart .NET components into your industrial process monitoring application and benefit from a library that supports multi-channel monitoring, a massive amount of real and historical data process, and the most efficient use of GPU and CPU resources. LightningChart .NET is available for WinForms, WPF, and UWP.
Integrate LightningChart .NET components into your industrial process monitoring application and benefit from a library that supports multi-channel monitoring, a massive amount of real and historical data process, and the most efficient use of GPU and CPU resources. LightningChart .NET is available for WinForms, WPF, and UWP.
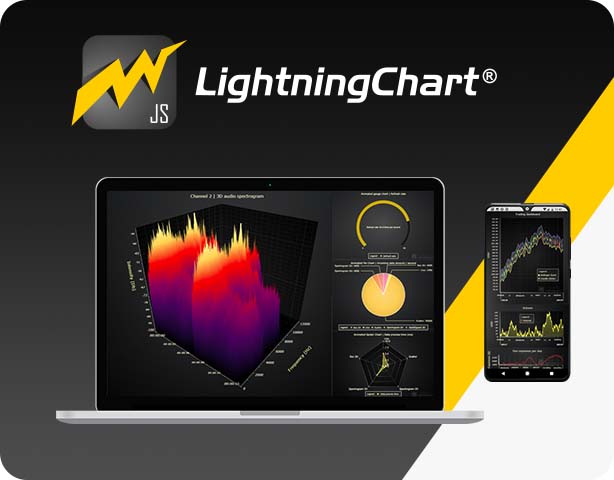
LightningChart JS for cross-platform development. Supports modern development frameworks.
Kickstart your development process by using several available development frameworks. LightningChart JS supports real-time and data-intensive process.
How can LightningChart components build powerful industrial process monitoring apps?
LightningChart JS and .NET chart components are highly optimized for performance, making them your best option when handling real-time industrial monitoring data. LightningChart JS’ cross-platform compatibility allows you to run apps on several devices making it one of the most preferred lightweight options for developing multi-platform industrial monitoring solutions. Both .NET and JS libraries offer you a wide range of ready-made examples for different industry-purposes that’ll help you easily get started on your own project.

You are in good company
Read how LightningChart has helped these companies develop their applications


Get started with LightningChart Industrial Process Monitoring Charts
Start development with LightningChart

TutorialCreate a Digital Signal Process Filters App

TutorialLearn how to create a Signal Persistent Intensity chart


If you have any questions, feel free to contact us!
©LightningChart Ltd 2026. All rights reserved.