
Elevate your Python data visualization capabilities to the next level - LightningChart® Python charts enable super-fast 2D and 3D visualizations for large data sets. Create stunning real-time visualizations with instant responsiveness.
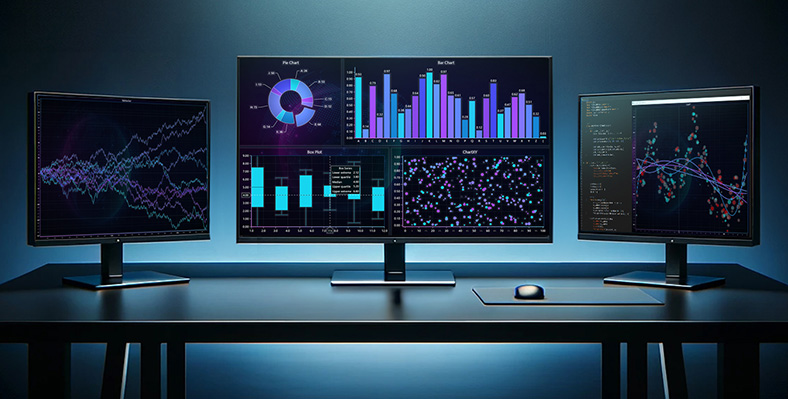
Whether you're a data scientist seeking to uncover hidden insights, or a developer building cutting-edge software applications, GPU-accelerated LightningChart® Python charts captivate and engage your audience.
Features
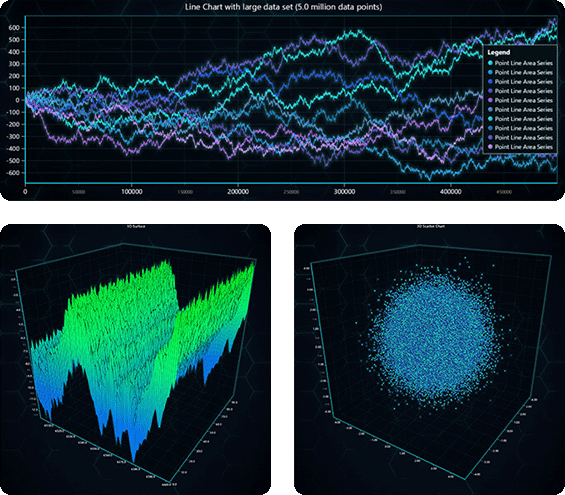
When dealing with massive static datasets or dynamic real-time streaming data, LightningChart Python can be used to turn them into fully interactive and responsive charts with smooth performance.
LightningChart® Python charts achieve this by harnessing the raw processing power of graphics processors and leveraging WebGL rendering, enabling the smooth visualization of up to millions of data points.
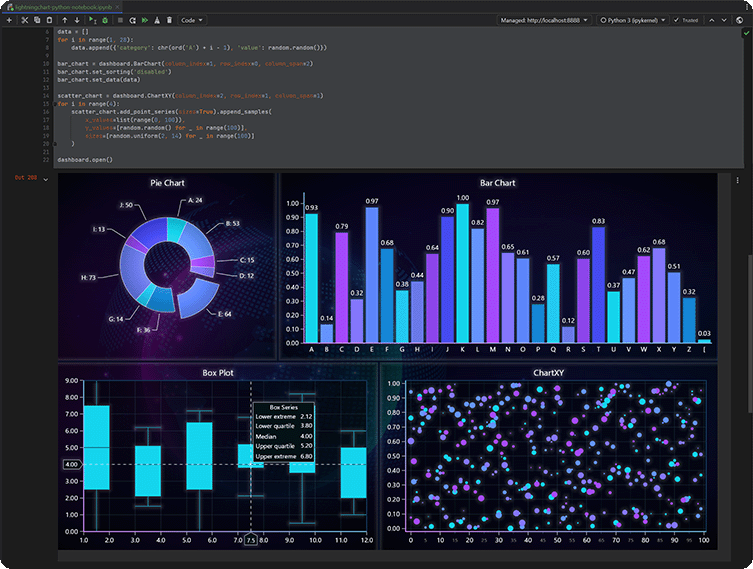
For data scientists, researchers, or educators looking to enhance their data analysis capabilities, seamlessly integrate LightningChart Python into your workflow. Whether you’re writing standalone scripts or utilizing Notebook environments, our library empowers you to perform exploratory data analysis effortlessly.
Use LightningChart® Python seamlessly with popular data science modules like numpy and pandas, unleashing the potential to glean valuable insights from your datasets.
Craft visually stunning and dynamic dashboards with ease, with extensive collection of different chart types and appearance customization options put you in control.

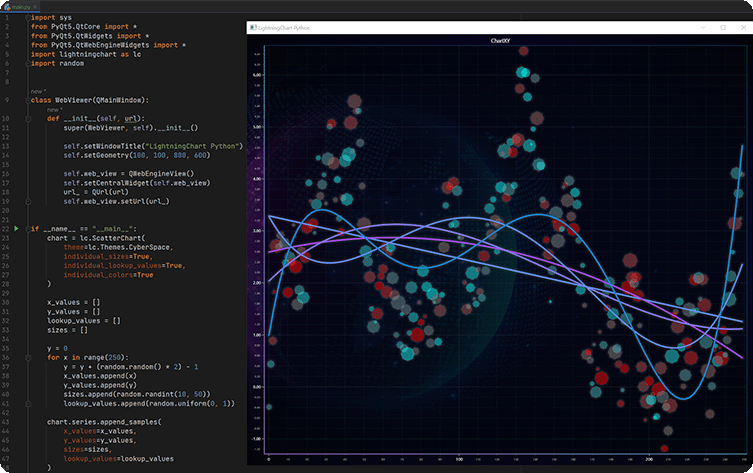
If you’re developing traditional software, such as desktop applications, LightningChart® Python charts can be used within popular GUI frameworks, such as PyQt and PySide, to embed interactive and dynamic visuals into your Python software.
When developing desktop applications for business analytics, monitoring, scientific simulations, or any other domain, our library simplifies the process of incorporating stunning visuals. Revolutionize your applications with the inclusion of our versatile visualization library.
Licensing
During the beta, we are thrilled to offer LightningChart® Python for free, for personal usage. This is your opportunity to experience firsthand the unparalleled performance and versatility our library brings to your Python projects.
Your feedback and usage during the beta phase are invaluable to us, shaping the future of LightningChart® Python. We look forward to hearing your feedback of the Beta version.
Following the beta release of Python charts, as we continue to enhance and expand the features of LightningChart® Python, we will be offering two distinct licensing options for your needs:
Data Scientist license
Software Developer license
A perpetual license, sold per-seat, for developers integrating LightningChart® Python in distributable software applications.
In a case you want to acquire the software developer license, as well as the right to deploy LightningChart® Python with your application during the Beta, please contact us.

