LightningChart JS Trader is out now!
LightningChart JS Trader is a comprehensive charting package to build industry-leading applications for finance and trading.
LightningChart JS Trader
We’re delighted to announce the new LightningChart JS Trader charting package for building industry-leading finance and trading applications. This new charting package features a comprehensive collection of:
- Technical analysis charts including technical indicators, drawing tools, and UI customization options
- DataGrid controls
- Real-time charts
- More versatile chart types

Technical Analysis Chart Components
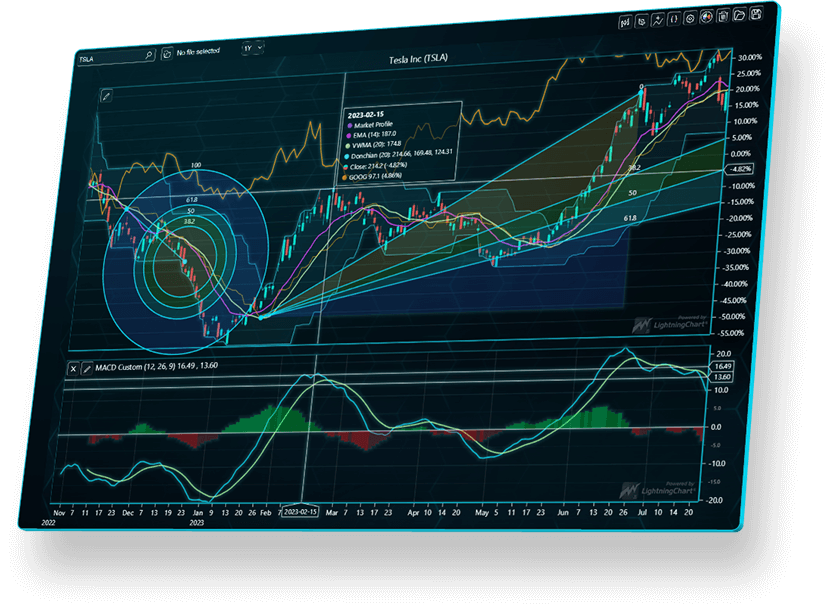
One of the features of the LightningChart JS Trader are the technical analysis charts such as CandleStick, Bar charts, Line charts, and Mountain charts.

Example of LightningChart JS Trader Technical Analysis chart
Technical Indicators
LightningChart JS Trader features more than 100 technical indicators. Some of the technical indicator types included are:
- Envelopes: Bollinger Band, Donchian Channels, Fractal Chaos Bands…
- Moving Averages: EMA, SMA, TMA…
- Oscillators – Money Flow: A/D, Chaikin Money Flow, Ease of Movement…
- Oscillators – Price: Aroon Oscillator, Awesome Oscillator, Balance of Power…
- Statistics: Correlation coefficient, Kurtosis, Median Price…
- Trend Indicators: ASI, ADX, Aroon
- Volatility: Average True Range, Chaikin Volatility, Z-Value…
Altogether, the 100+ indicators are fully customizable via UI or code.
Drawing Tools
LightningChart JS Trader comes with 33 different drawing tools:
- Lines
- Fibonaccis
- Patterns
- Channels
- Measurement
- Text
- Shapes
- Symbols & Objects
DataGrid
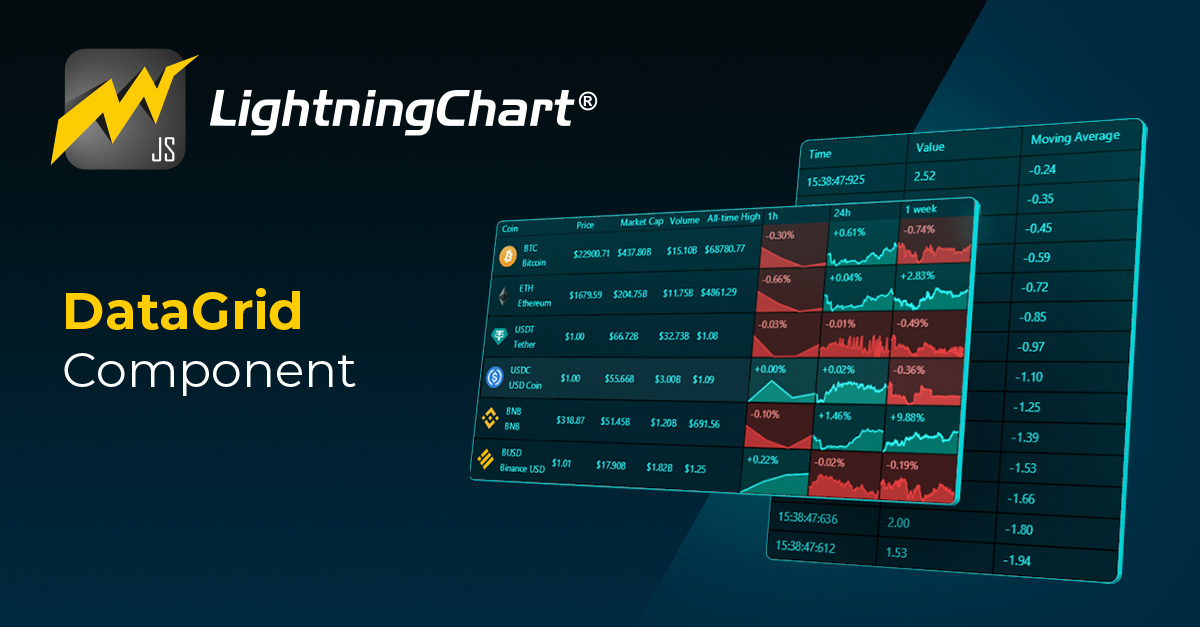
LightningChart JS Trader features the most advanced DataGrid control for JS applications. The DataGrid control is a top-level UI component that can be used as part of a dashboard application but can be used as a standalone control as well.
DataGrid supports an unlimited number of rows and columns, a table-like style, drill-down menus, and real-time status monitoring. DataGrid is a powerful control for building finance and trading applications in JavaScript. More features of the DataGrid component include Spark charts, dynamic coloring, cell-merging, etc.
Real-Time Charts
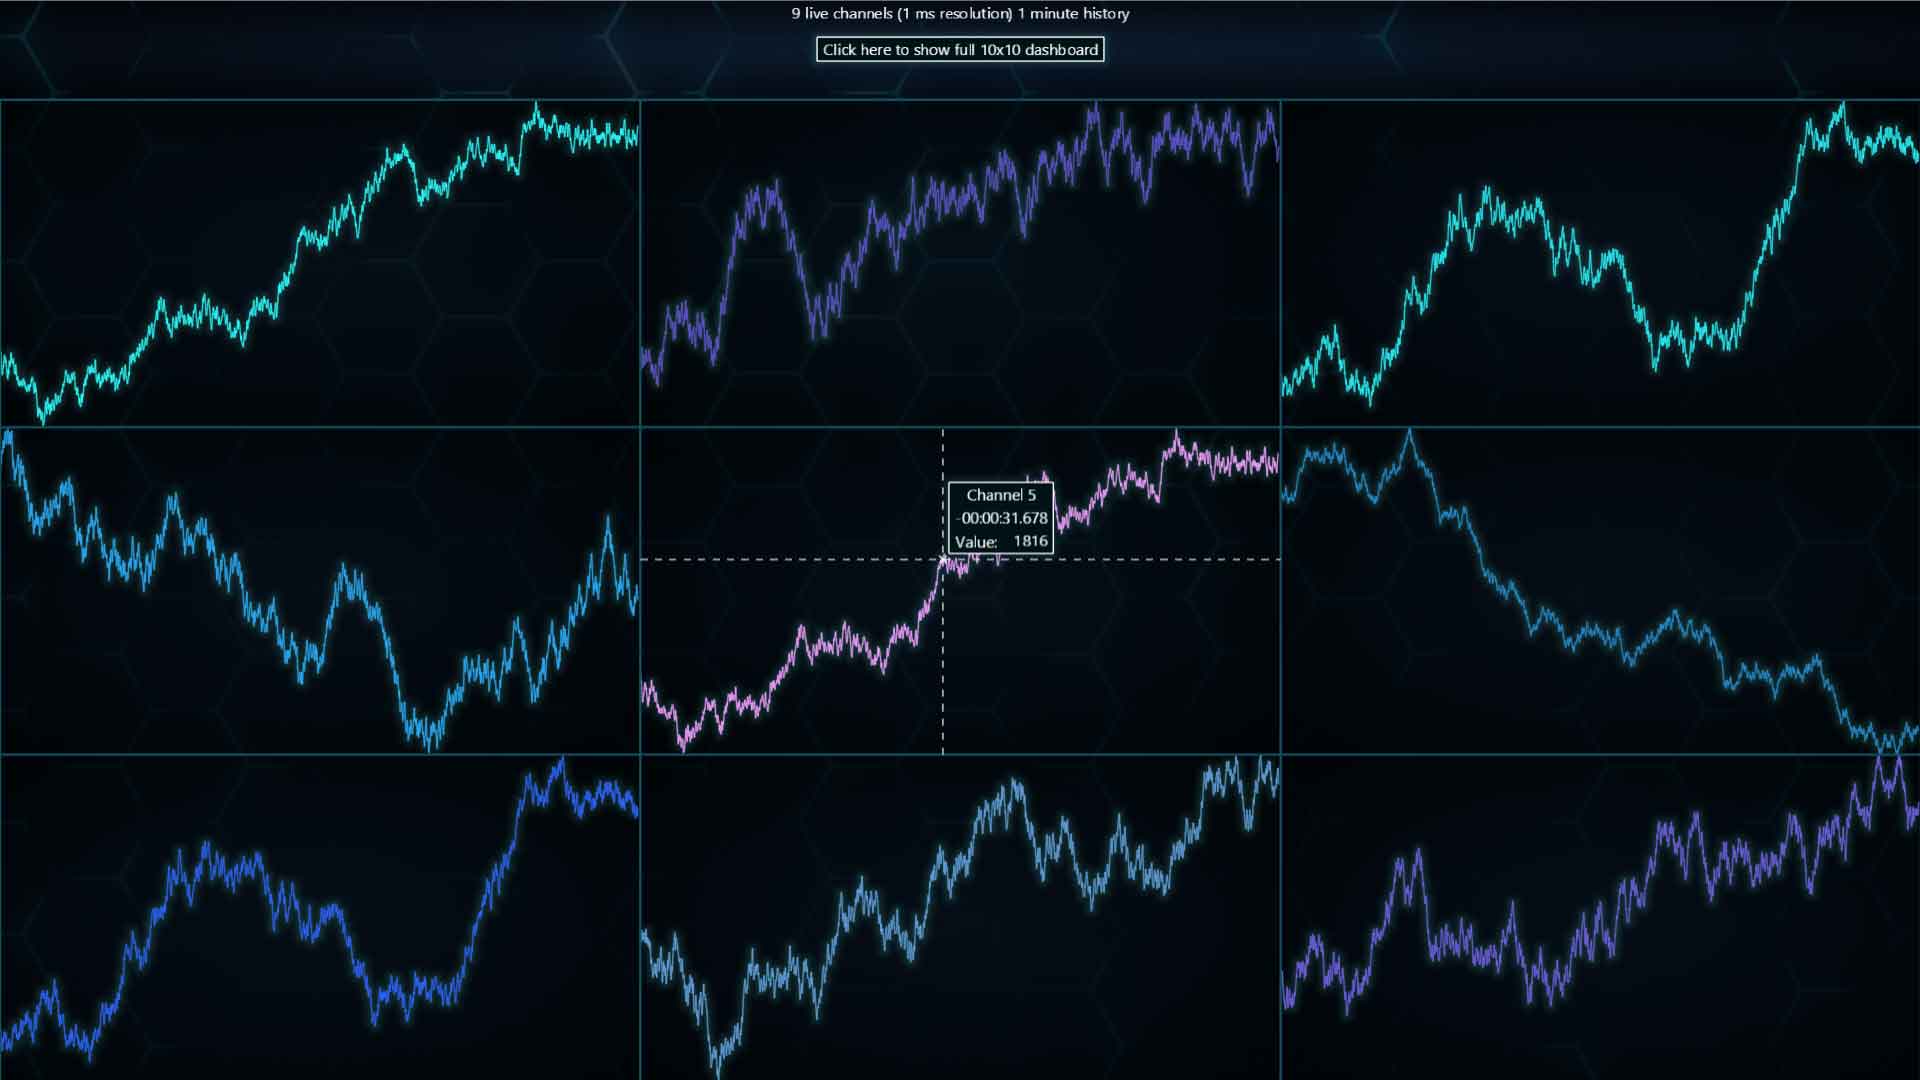
LightningChart JS Trader features real-time charts powered by the state-of-the-art technology of LightningChart JS charts.

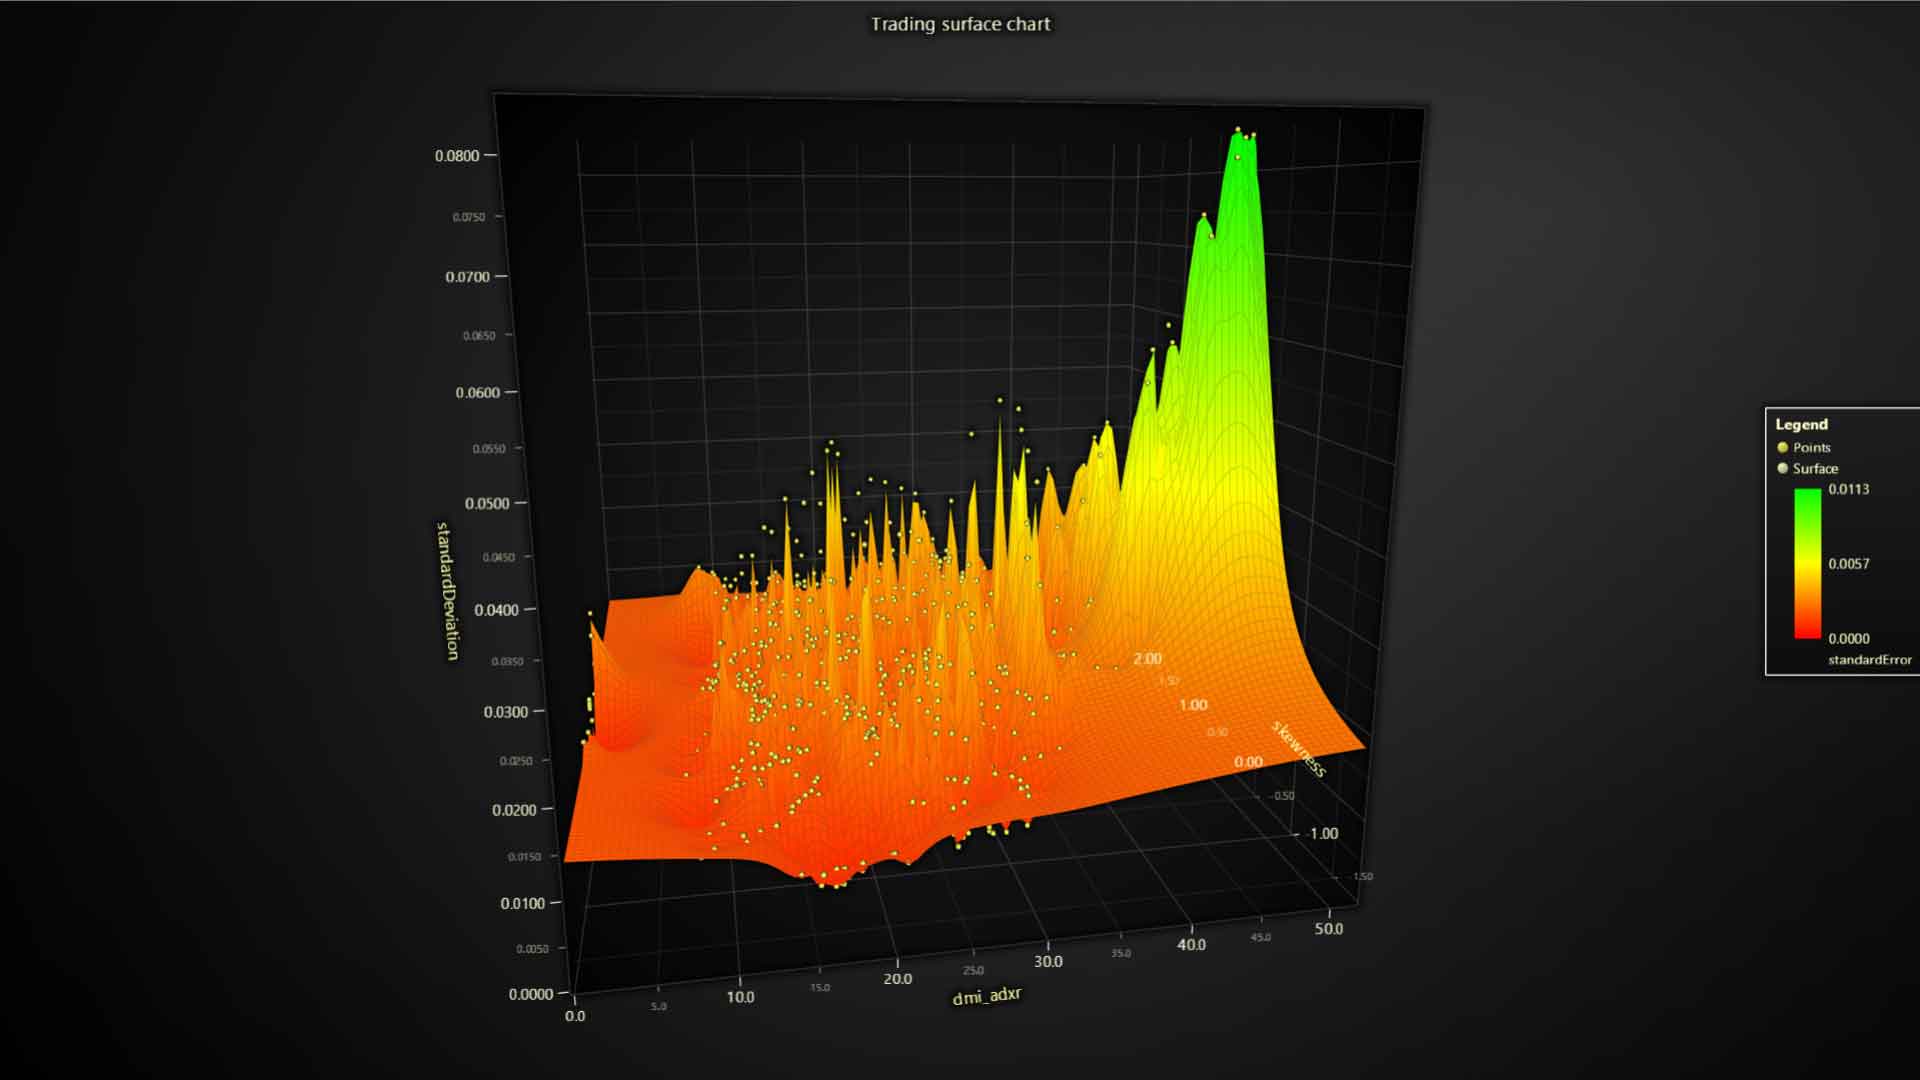
Some of the Real-Time charts available in LightningChart JS Trader include Technical Analysis charts, DataGrid, Trending charts, Heatmaps, Surface charts, and GeoMaps.
Other Versatile Charts

The comprehensive LightningChart JS Trader features more than 30 versatile charts that support the development of industry-leading applications for the finance and trading industry.
Some of these versatile charts include:
- Annotation charts
- Markers
- Line charts
- Pie charts
- Donut charts
- Polar area charts
- Spider charts
- 3D mesh models
- Scrolling real-time 3D surface charts
To see the full list of versatile charts featured in the LightningChart JS Trader, refer to the JS Trader product page.
Resources
We’re introducing a new series of technical analysis blog resources. These resources include key information to understand each feature (technical charts, technical indicators, drawing tools) of the LightningChart JS Trader. We hope you find these resources helpful:
Materials about technical indicators
- Review the 9 different types of Envelope technical indicators
- The importance of Money Flow Oscillators in the volume of shares
- Introduction to Ichimoku Cloud
- How to use Ichimoku Cloud in the LightningChart Trader
- An overview of the Aroon technical indicator
- How to use Aroon in the LightningChart Trader
Resources about drawing tools
- An overview of XABCD patterns in stock and trading charts
Resources about DataGrid
Licensing Changes: existing LightningChart JavaScript Customers
With the release of LightningChart JS v.5.0 in November 2023, chart types designed for Trading applications will be available exclusively under a separate LC JS license. Trading charts will no longer be available as part of the standard LightningChart JS library and its trial versions. The charts impacted by this update are the Candlestick Series and the OHLC Bar series.
For existing customers:
Before the release of LightningChart JS v.5, you can continue using trading charts version 4.2 and below. If you, however, would like to upgrade to the updated Trading Charts v.5, we would be happy to activate a Special LC JS license for you at no additional cost, which will include the two updated Candlestick Series and OHLC Bar Series. Note that you can claim a no-additional-cost Special LC JS license, if you purchased a LightningChart JS license subscription before November 30, 2023, and is still active.
After claiming the Special LC JS license, you can continue using the two updated Trading charts with v.5 for the time your current standard LightningChart JS license subscription remains active. In case you would like to use the two updated Trading charts, contact your account manager or send us a message for activation.
After your original LightningChart JS license expires, you will no longer have access to Trading charts with the LCJS library. A separate LCJS Trader license will be required; learn more about LightningChart JS Trader.
LightningChart JS Trader licenses can be acquired starting from December 7th, 2023 at a special introductory price. You can contact us for more information.
Licensing Changes: new customers
What does this mean for new prospects and customers?
Starting with LightningChart JS v5.0, Trading charts and the brand-new features included in LightningChart JS Trader are restricted to users who explicitly require the product for Trading use cases.
Our Trading charts and features will no longer be available as part of the standard LCJS charting library and trial version. This means that these features will only be available with a dedicated LC JS Trader license for development and deployment. If you are a new user and need the Trading charts and features in your use case, contact us directly for more information.
Explore the LightningChart JS Trader
Getting started with LightningChart Trader is easy. We’ve compiled several resources, videos, and key information that will help you get acquainted with the best stock and trading chart library. Get started and learn more about the Trader.
See more news
SQL and LightningChart JS dashboard
Published on April 18th, 2024 | Written by humanSQL Dashboard ApplicationHello! In today's article, we will see work on a small project using several development tools. We will create an SQL Dashboard with data generated in SQL Server and use Angular for web...
Alpha Omega Engineering
Date of case study: 04/2024Industry of business: Clinical NeuroscienceEstablished: 1993LightningChart solution: XY ChartsAlpha Omega EngineeringAlpha Omega is the market leader in physiological navigation for advanced neurosurgical procedures, like deep brain...
JavaScript 2D Bubble Chart
JavaScript 2D Bubble ChartIn this article, we will create a JavaScript 2D bubble chart using Node JS and LightningChart JS. Remember that you can download the template and use it to experiment with it. When we are looking for an attractive way to represent our data,...
Create a JavaScript Stacked Bar Chart
JavaScript Stacked Bar ChartStacked bar charts are very useful in scenarios where we see large groups of data from different categories, or values from each other. We can see how a category is divided into segments, from the largest to the smallest in relation to...

