


LightningChart JS Performance Comparison
Here’s how LightningChart JS performance compares to 23 different JS charting libraries.
Summary Results
Data Loading Speed
Times faster, than other data visualization solutions
Data Streaming Applications
Times more performant than other solutions
Datasets size
Times larger than other data visualization solutions
The following results are on average and highlight how faster LightningChart JS is compared to other JS graphing libraries.

More LightningChart JS v.7.1 results
Interactive line charts can visualize datasets with a maximum of 1,500 million data points.
10 million data points can be loaded and displayed in the blink of an eye in only 0.29 seconds.
LightningChart JS can display 400 channels simultaneously with 1 000 Hz data stream rate per channel and 1 minute time window, adding up to a grand total of 24 million data points visible at every frame and updated at 60 FPS.

Libraries Tested
In the context of “high-performance” charting solutions, it is common for libraries to tag their solutions as “extremely performant” but when a solution is compared to another library, the performance may be poor.
Every year we carry out a comprehensive performance comparison where we test LightningChart JS and every viable JS charting library alternative. The performance test is an open-source repository that aims to demonstrate with statistics and factual reporting how LightningChart JS excels compared to other JS graphing libraries.
We tested 23 different libraries whose names will be protected under aliases, e.g., “Competitor A, Competitor B, Competitor C, etc.”. The libraries we tested were:
v.11.2.0

v.5

v.1.8.0

v.2.27.0

v.3.2.516

v.5.4.3

v.5.1.0.0

v.2.2.1

v.2.9.13

v.0.7.20

v.2

v.1.7.45

v.1.6.27

v.8.12.0

v.3.44.2

April 2023 version

v.23.1.6

v.4.4.0

v.4.6.1

v.3.21.1

v.1.36.1

v0.8.4

Evaluation
We measured 3 different performance metrics for 5 different chart types.
Data Loading Speed
A parameter measured in seconds that tells how many seconds the chart takes to do a cold start, load a static dataset, and be fully visible
Maximum Data Capacity
A parameter that measures how large are the datasets that each solution can visualize. Scores are measured as numbers of data points across all channels.
Streaming Data Performance
A parameter that measures how efficiently each charting library can consume and display streaming data.
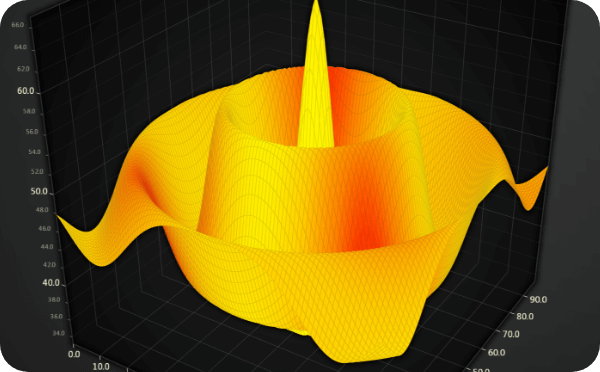
The 5 different chart types evaluated were the following
Results
| Solution | Data Loading Speed | Streaming Data Performance | Maximum Data Capacity |
|---|---|---|---|
| LightningChart JS | Fastest | Best score | Largest data capacity |
| Competitor D | 4.9x slower | 500x worse | 30.0x smaller |
| Competitor E | 1782.6x slower | 345640x worse | 15000.0x smaller |
| Competitor G | 4061.1x slower | 2716240x worse | 15000.0x smaller |
| Competitor B | 13802.3x slower | 6235020x worse | 15000.0x smaller |
| Competitor F | 4824.8x slower | 542610x worse | 15000.0x smaller |
| Competitor H | 1643.5x slower | 432140x worse | 1500.0x smaller |
| Competitor J | - | - | - |
| Competitor A | 2091.9x slower | 7911510x worse | 15000.0x smaller |
| Competitor C | 695.0x slower | 655120x worse | 15000.0x smaller |
| Competitor I | 333.2x slower | 91720x worse | 1500.0x smaller |
| Competitor K | 363.1x slower | 78110x worse | 1500.0x smaller |
| Competitor L | 16730.6x slower | - | 150000.0x smaller |
| Competitor M | 4689.8x slower | 1046960x worse | 15000.0x smaller |
| Competitor N | 2295.4x slower | 157190x worse | 15000.0x smaller |
| Competitor O | 28.7x slower | 165710x worse | 30.0x smaller |
| Competitor P | 1099.4x slower | 461930x worse | 15000.0x smaller |
| Competitor Q | - | 4990x worse | 15000.0x smaller |
| Competitor R | 10320.0x slower | 4990x worse | 15000.0x smaller |
| Competitor S | 2039.8x slower | - | 15000.0x smaller |
| Competitor T | 169.6x slower | 87250x worse | 1500.0x smaller |
| Competitor U | 2955.8x slower | 6041910x worse | 15000.0x smaller |
Results
| Solution | Data Loading Speed | Streaming Data Performance | Maximum Data Capacity |
|---|---|---|---|
| LightningChart JS | Fastest | Best score | Largest data capacity |
| Competitor D | 2.2x slower | 4.2x worse | 2.0x smaller |
| Competitor E | 867.8x slower | 3470x worse | 100.0x smaller |
| Competitor G | 5083.7x slower | 35980x worse | 10000.0x smaller |
| Competitor B | 10735.5x slower | 112820x worse | 10000.0x smaller |
| Competitor F | 1999.8x slower | 4380x worse | 1000.0x smaller |
| Competitor H | 510.3x slower | 2070x worse | 100.0x smaller |
| Competitor J | 2325.6x slower | 2860x worse | 1000.0x smaller |
| Competitor A | - | - | - |
| Competitor C | - | - | - |
| Competitor I | 321.5x slower | 1150x worse | 100.0x smaller |
| Competitor K | - | - | - |
| Competitor L | - | - | - |
| Competitor M | 2450.2x slower | 12810x worse | 1000.0x smaller |
| Competitor N | 1682.6x slower | 6190x worse | 1000.0x smaller |
| Competitor O | 2204.7x slower | 24220x worse | 1000.0x smaller |
| Competitor P | 4451.3x slower | 14410x worse | 10000.0x smaller |
| Competitor Q | - | - | - |
| Competitor R | 4085.2x slower | 17230x worse | 10000.0x smaller |
| Competitor S | 2164.0x slower | - | 1000.0x smaller |
| Competitor T | 18.5x slower | 280x worse | 2.0x smaller |
| Competitor U | 2605.7x slower | 82600x worse | 1000.0x smaller |
Results
| Solution | Data Loading Speed | Streaming Data Performance | Maximum Data Capacity |
|---|---|---|---|
| LightningChart JS | Fastest | Best score | Largest data capacity |
| Competitor D | 11.4x slower | 1010x worse | 30.0x smaller |
| Competitor E | 2492.9x slower | 413370x worse | 15000.0x smaller |
| Competitor G | 6814.8x slower | 2943840x worse | 15000.0x smaller |
| Competitor B | 17496.1x slower | 6304780x worse | 15000.0x smaller |
| Competitor F | 5251.3x slower | 595640x worse | 15000.0x smaller |
| Competitor H | 1740.3x slower | 495890x worse | 1500.0x smaller |
| Competitor J | 6614.5x slower | 390660x worse | 15000.0x smaller |
| Competitor A | 2427.3x slower | 6034390x worse | 15000.0x smaller |
| Competitor C | 105.6x slower | 671280x worse | 150.0x smaller |
| Competitor I | 404.9x slower | 140520x worse | 1500.0x smaller |
| Competitor K | 829.0x slower | 123770x worse | 15000.0x smaller |
| Competitor L | 17221.1x slower | - | 150000.0x smaller |
| Competitor M | 5590.9x slower | 1105470x worse | 15000.0x smaller |
| Competitor N | 3065.7x slower | 249630x worse | 15000.0x smaller |
| Competitor O | 32.4x slower | 379730x worse | 30.0x smaller |
| Competitor P | 1823.1x slower | 479390x worse | 15000.0x smaller |
| Competitor Q | - | 82890x worse | 15000.0x smaller |
| Competitor R | 13405.6x slower | 1830610x worse | 15000.0x smaller |
| Competitor S | 2745.8x slower | - | 15000.0x smaller |
| Competitor T | 193.2x slower | 137820x worse | 1500.0x smaller |
| Competitor U | 3454.3x slower | 7234200x worse | 15000.0x smaller |
Results
| Solution | Data Loading Speed | Streaming Data Performance | Maximum Data Capacity |
|---|---|---|---|
| LightningChart JS | Fastest | Best score | Largest data capacity |
| Competitor D | 142.4x slower | 16630x worse | 1500.0x smaller |
| Competitor E | 3785.8x slower | 388950x worse | 15000.0x smaller |
| Competitor G | 7989.4x slower | 2915350x worse | 15000.0x smaller |
| Competitor B | - | - | - |
| Competitor F | 7442.1x slower | 577580x worse | 15000.0x smaller |
| Competitor H | 1806.2x slower | 539490x worse | 1500.0x smaller |
| Competitor J | - | - | - |
| Competitor A | 5074.0x slower | 15538910x worse | 15000.0x smaller |
| Competitor C | 8192.8x slower | 684010x worse | 15000.0x smaller |
| Competitor I | 1487.7x slower | 197900x worse | 1500.0x smaller |
| Competitor K | 1439.5x slower | 189920x worse | 1500.0x smaller |
| Competitor L | 16732.9x slower | - | 150000.0x smaller |
| Competitor M | 5883.9x slower | 1106820x worse | 15000.0x smaller |
| Competitor N | 3423.9x slower | 267310x worse | 15000.0x smaller |
| Competitor O | 3416.2x slower | 559370x worse | 15000.0x smaller |
| Competitor P | 3530.2x slower | 505390x worse | 15000.0x smaller |
| Competitor Q | - | 100700x worse | 15000.0x smaller |
| Competitor R | 12090.6x slower | 1768800x worse | 15000.0x smaller |
| Competitor S | 2697.2x slower | - | 15000.0x smaller |
| Competitor T | 1770.4x slower | 163430x worse | 1500.0x smaller |
| Competitor U | 2973.9x slower | 10193390x worse | 15000.0x smaller |
Results
| Solution | Data Loading Speed | Streaming Data Performance | Maximum Data Capacity |
|---|---|---|---|
| LightningChart JS | Fastest | Best score | Largest data capacity |
| Competitor D | 4.2x slower | 340x worse | 30.0x smaller |
| Competitor E | 2793.3x slower | 430370x worse | 1500.0x smaller |
| Competitor G | 6524.2x slower | 2841440x worse | 15000.0x smaller |
| Competitor B | 13703.0x slower | 6255210x worse | 15000.0x smaller |
| Competitor F | 3932.8x slower | 471740x worse | 15000.0x smaller |
| Competitor H | 1742.0x slower | 373350x worse | 1500.0x smaller |
| Competitor J | - | - | - |
| Competitor A | 3254.9x slower | 15415210x worse | 15000.0x smaller |
| Competitor C | 662.9x slower | 665150x worse | 15000.0x smaller |
| Competitor I | 30.4x slower | 93760x worse | 150.0x smaller |
| Competitor K | 373.3x slower | 79590x worse | 1500.0x smaller |
| Competitor L | 16660.0x slower | - | 150000.0x smaller |
| Competitor M | - | - | - |
| Competitor N | 2490.2x slower | 151570x worse | 15000.0x smaller |
| Competitor O | 1605.6x slower | 160900x worse | 15000.0x smaller |
| Competitor P | 1877.1x slower | 470230x worse | 15000.0x smaller |
| Competitor Q | - | 5020x worse | 15000.0x smaller |
| Competitor R | 10320.0x slower | 4990x worse | 15000.0x smaller |
| Competitor S | - | - | - |
| Competitor T | 702.1x slower | 74020x worse | 15000.0x smaller |
| Competitor U | 3347.7x slower | 6492710x worse | 15000.0x smaller |
Replicating the test
The open-source project can be accessed directly on GitHub from the official LightningChart JS performance comparison note. This test was performed under specific conditions including recording the results on an average desktop computer for software development. Although we cannot claim that everyone can get the exact results, we encourage you to look at the project by yourself.
For specific commands for replicating this performance test, please refer to the GitHub official note, under the section Replicating performance test results.
Conclusion
This is an annual performance comparison between LightningChart JS and the most relevant JS graphing libraries. We have included almost every JS-based data visualization library that we could find. To give a fair shot to JavaScript data visualization solutions, this test included:
- commercial and non-commercial libraries
- open-source and closed-source libraries
- real-time oriented hardware-accelerated libraries
- industry favorites
- small players
Lastly, we observed different visualization errors during the test and all of those were recorded and are listed in a dedicated Visualization Errors section on the GitHub note. Every year we aim to deliver only the best and highest possible performance to all our users, this is the motivation behind this performance comparison test.
Read more about LightningChart JS performance

Heatmaps Performance Comparison
Surface Grid Charts Performance Comparison

Performance Test Results
Performance Demo


If you have any questions, feel free to contact us!
©LightningChart Ltd 2026. All rights reserved.