Introduction
LightningChart Python is a data visualization library for the Python programming language. With LightningChart Python, you can visualize real-time or static data as interactive charts with top performance.
Getting Started
Requirements
LightningChart Python requires Python version 3.10 or higher.
Installation
LightningChart Python can be installed from the Python Package Index (PyPI) using pip:
pip install lightningchart
Acquiring a license
LightningChart Python requires a license key to run. You can claim your free trial license key here.
Using the library
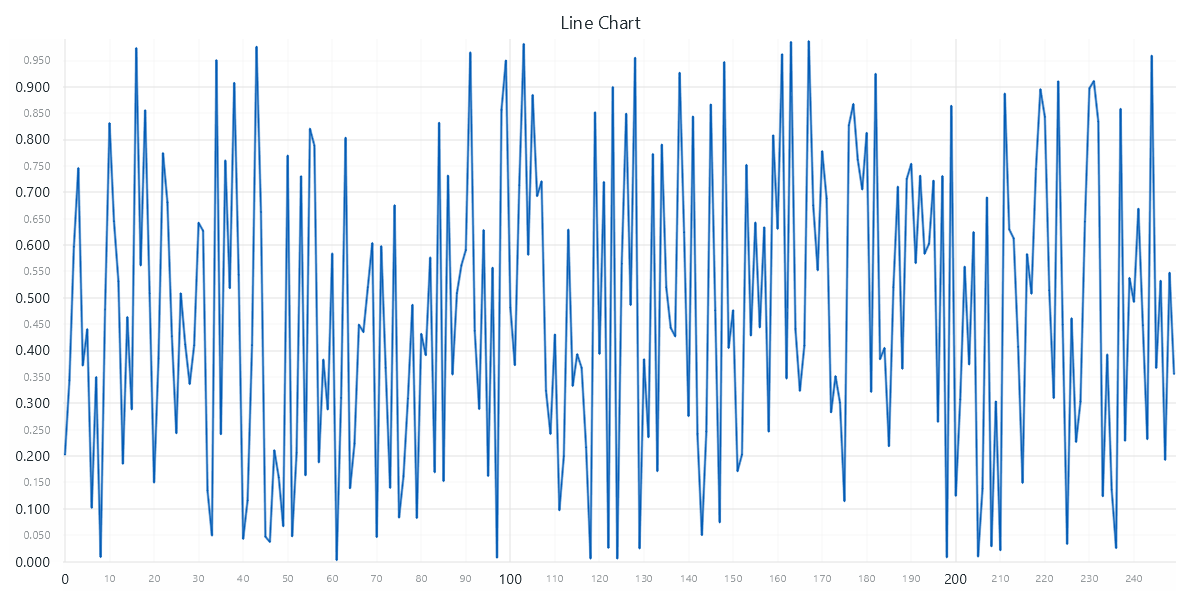
That's it! You can start creating charts with LightningChart Python, like so:
import lightningchart as lc
import random

lc.set_license('my-license-key')

x = list(range(0, 250))
y = [random.random() for _ in range(250)]

chart = lc.ChartXY(
  theme=lc.Themes.Light,
  title='Line Chart'
)
line_series = chart.add_line_series().add(x, y)
chart.open()