


Energy Oil and Gas Charts
Develop production, reservoir, and performormance monitoring analysis applications with the most advanced charting components.
Energy oil and gas chart components for industry applications development
LightningChart features key chart components for the energy, oil, and gas industry including 2D and 3D LineSeries, Scatter charts, Area charts, Gauge charts, Waterfall, and more.
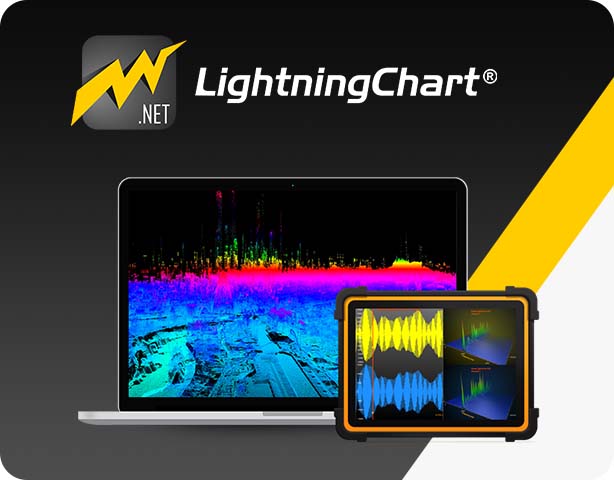
2D and 3D .NET charts for building desktop applications
You can build fully customizable applications using LightningChart .NET using pre-built components ready for integration, including XY Line Charts, 2D and 3D area charts, heatmaps, and more.
You can build fully customizable applications using LightningChart .NET using pre-built components ready for integration, including XY Line Charts, 2D and 3D area charts, heatmaps, and more.
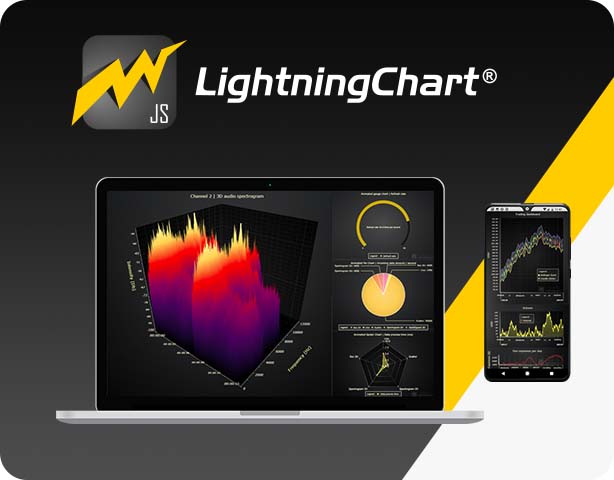
Develop high-performance cross-platform applications with LightningChart JS components
LightningChart JS cross-platform compatibility and high-performance guarantee your applications can process a large number of data points at the highest rendering speeds.
How can high-performance charting components benefit the Energy, Oil, and Gas industry?
In the energy, oil, and gas industry, powerful charting components play a critical role in real-time data visualization, enabling monitoring of performance, supporting advanced analysis, and enhancing user interaction with charting applications.
LightningChart .NET and JS provide unparalleled capabilities that surpass other libraries. These charting components excel at handling large datasets, allowing for real-time analysis with unbeatable performance.
Whether it’s monitoring production rates, analyzing reservoir data, or tracking equipment performance, LightningChart .NET and JS deliver only high-performance charting controls.

You are in good company
Read how LightningChart has helped these companies develop their applications


Get started with LightningChart Energy Oil and Gas Charts
Start development with LightningChart

TutorialDataGrid Monitoring Application

TutorialCreate a Vibration Charts Application


If you have any questions, feel free to contact us!
©LightningChart Ltd 2026. All rights reserved.