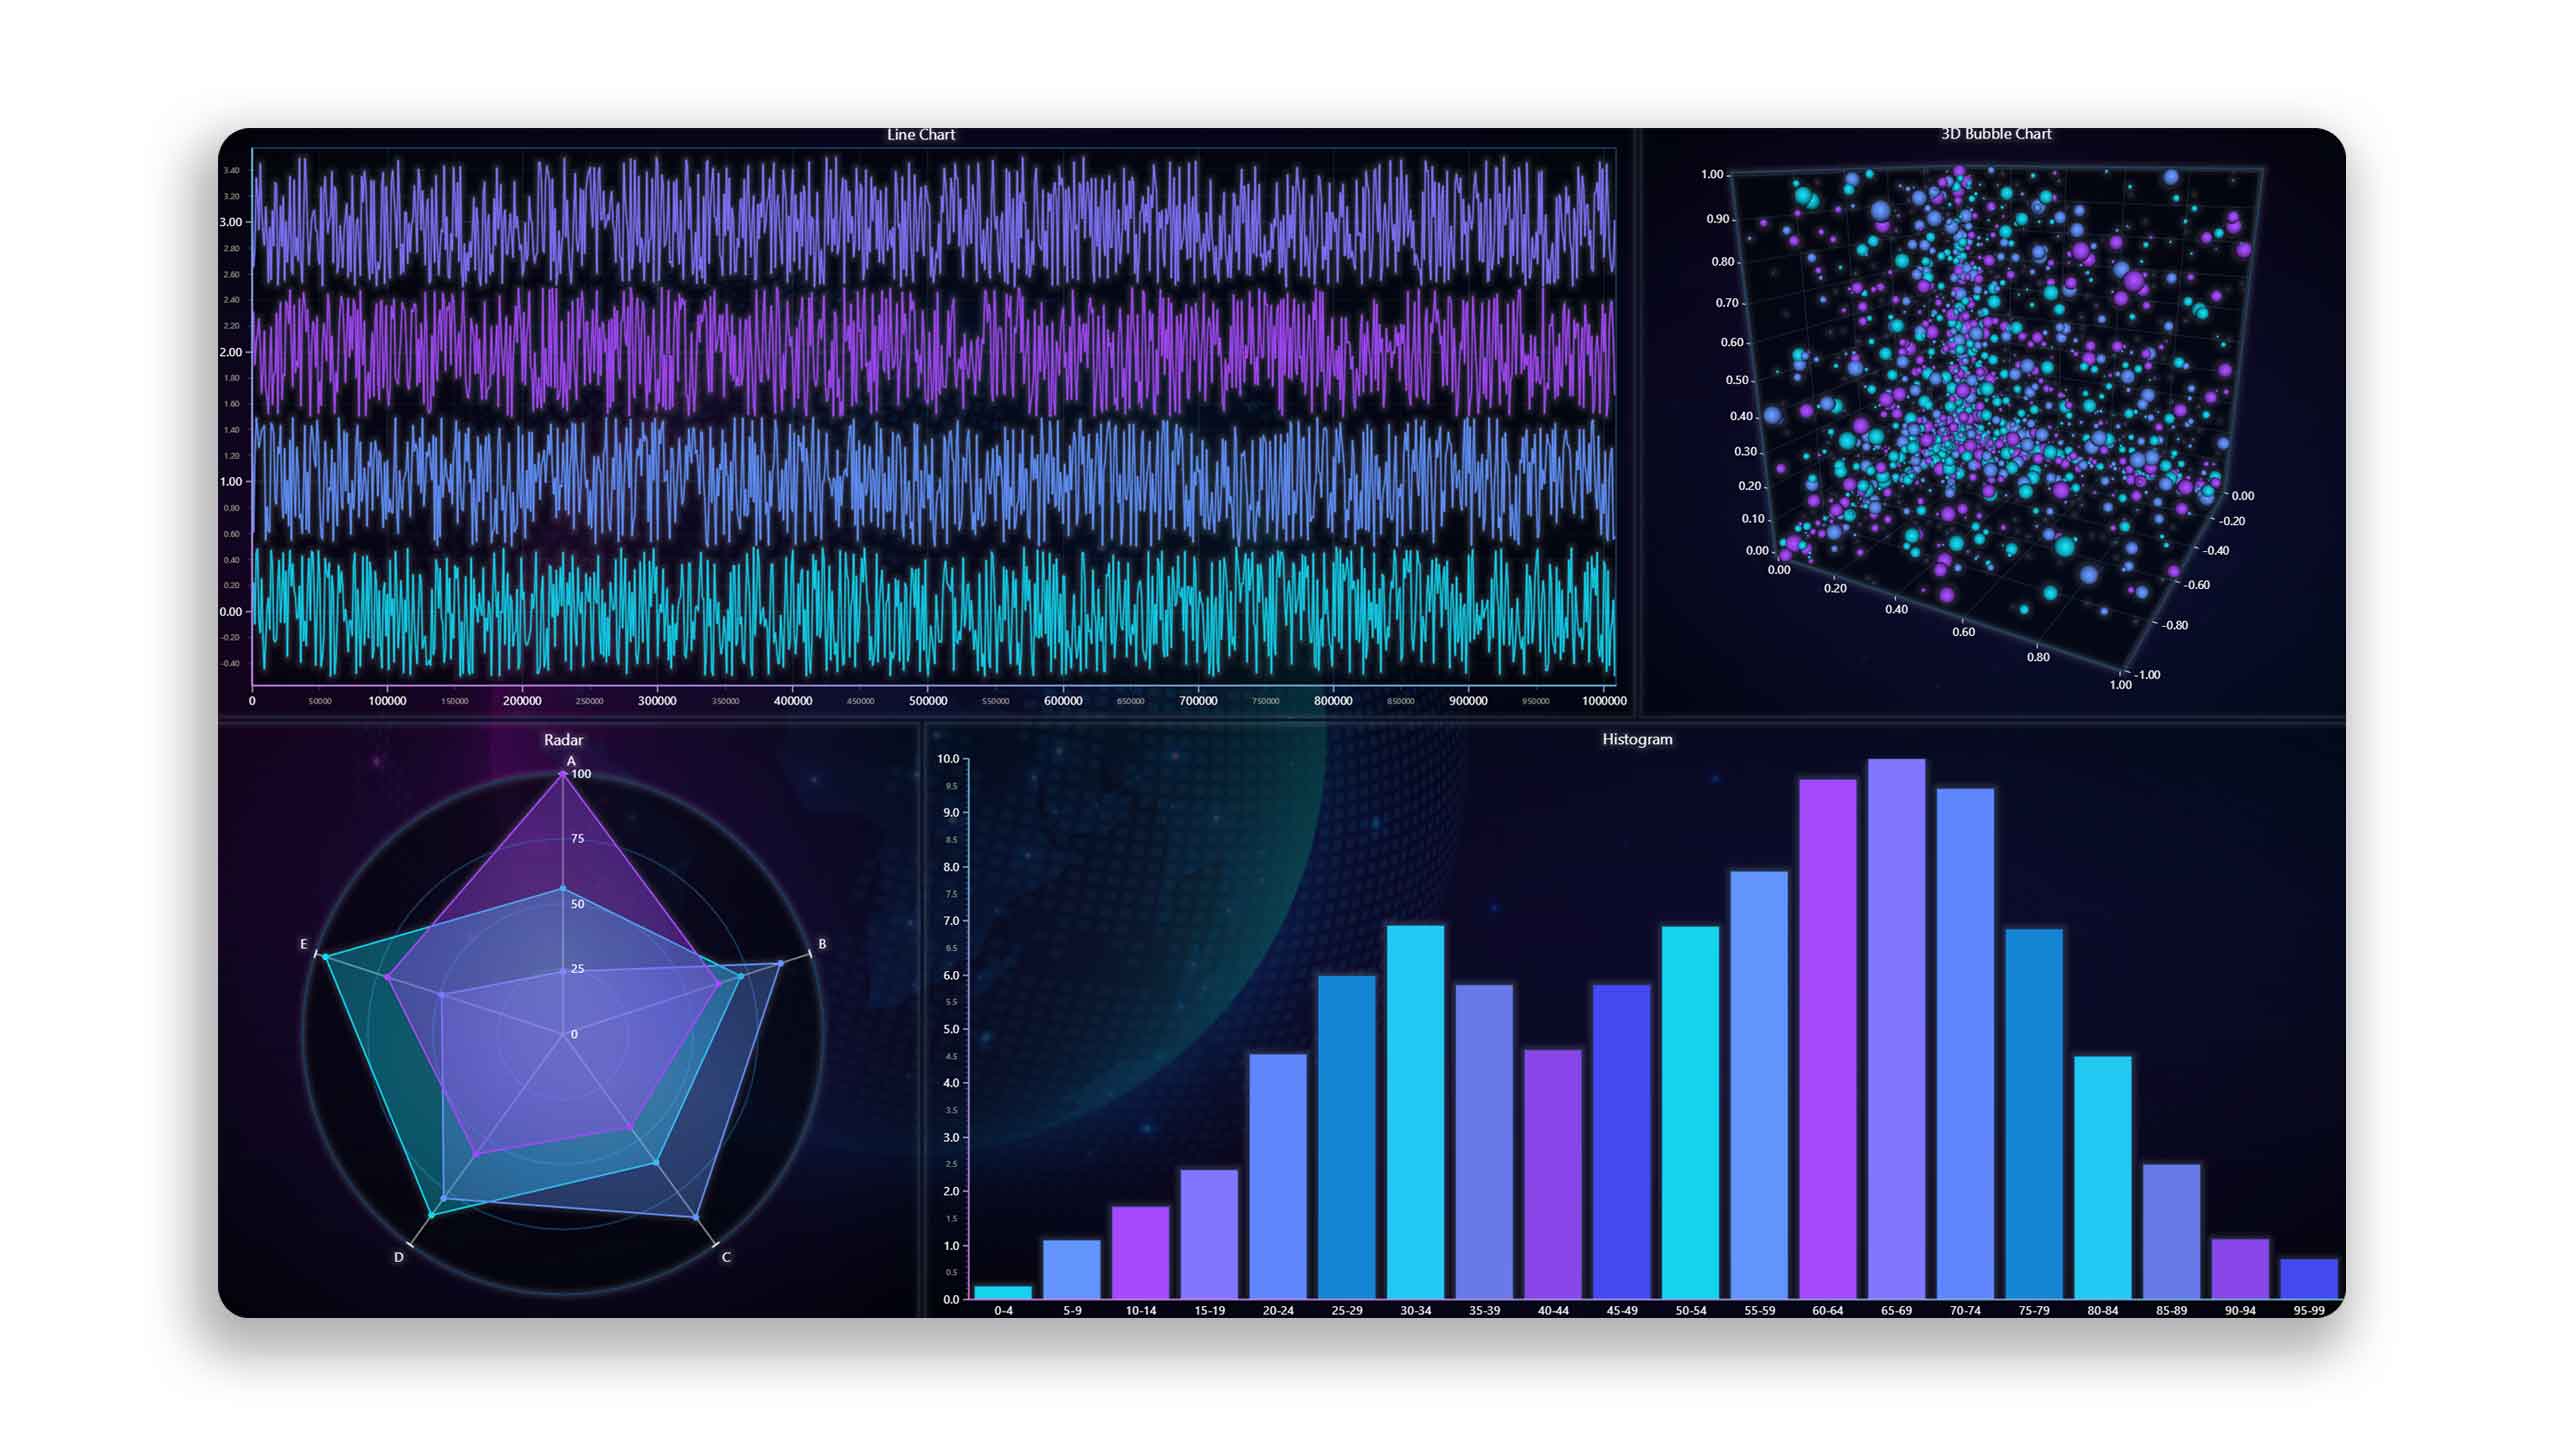
LightningChart Python has been released!
A dedicated data visualization library for Python programming language.
Introducing LightningChart Python
We are excited to announce the release of a dedicated data visualization library for Python that will deliver the signature lightning-fast speed and responsiveness of LightningChart components.
LightningChart Python delivers high-performance 2D and 3D charts for data analysis and software application development and can be used to enhance your Python projects to a new visual experience.
Features
LightningChart Python helps you add interactivity and responsiveness at the highest performance when dealing with massive static datasets and dynamic real-time streamed data. LightningChart Python is powered by WebGL-rendered graphics that help deliver the smoothest visualization experience of millions of data points.
Data scientists, researchers, and educators can now seamlessly integrate LC Python into their standalone scripts or notebook environments. LC Python can be used with data science modules like Numpy and Pandas. LC Python also allows the creation of dashboards featuring multiple chart types and provides extensive control for customization options.
Regarding application development, LC Python can be used within GUI frameworks such as PyQt and PySide for embedding interactive and dynamic charts into your Python software.

Get LightningChart Python
Feedback
We highly appreciate any feedback you provide us during the Beta stage. Please let us know your comments and requests to improve LC Python via email to [email protected]
See more news
SQL and LightningChart JS dashboard
Published on April 18th, 2024 | Written by humanSQL Dashboard ApplicationHello! In today's article, we will see work on a small project using several development tools. We will create an SQL Dashboard with data generated in SQL Server and use Angular for web...
Alpha Omega Engineering
Date of case study: 04/2024Industry of business: Clinical NeuroscienceEstablished: 1993LightningChart solution: XY ChartsAlpha Omega EngineeringAlpha Omega is the market leader in physiological navigation for advanced neurosurgical procedures, like deep brain...
JavaScript 2D Bubble Chart
JavaScript 2D Bubble ChartIn this article, we will create a JavaScript 2D bubble chart using Node JS and LightningChart JS. Remember that you can download the template and use it to experiment with it. When we are looking for an attractive way to represent our data,...
Create a JavaScript Stacked Bar Chart
JavaScript Stacked Bar ChartStacked bar charts are very useful in scenarios where we see large groups of data from different categories, or values from each other. We can see how a category is divided into segments, from the largest to the smallest in relation to...
