


Vibration Analysis Charts
Scientific .NET & JS charts for vibration measurement and
analysis in industrial and engineering sectors
Vibration analysis applications meet high-performance charts
We have developed state-of-the-art data visualization solutions for web and desktop application developers that require the highest performance for their vibration analysis software. Our charts for vibration analysis are available for .NET and JavaScript.
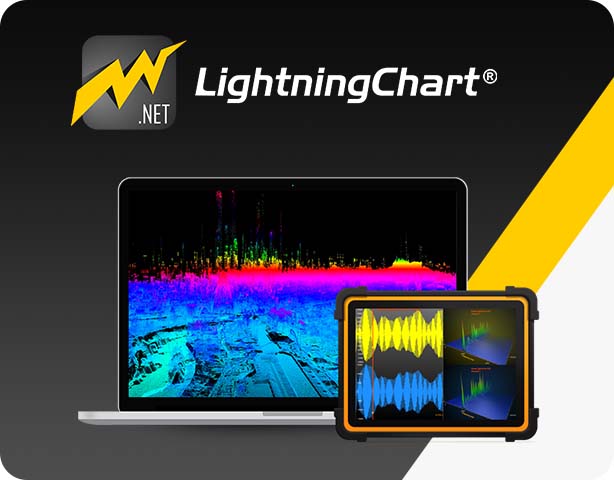
.NET charts that render billion data points
The .NET charting library features fast waveform displays capable of rendering up to billions of data points for continuous data logging.
LightningChart .NET comes with a SignalTools library, consisting of SpectrumCalculator, FFT converters, PC Audio I/O, SignalGenerator, and a waveform file reader with playback features.
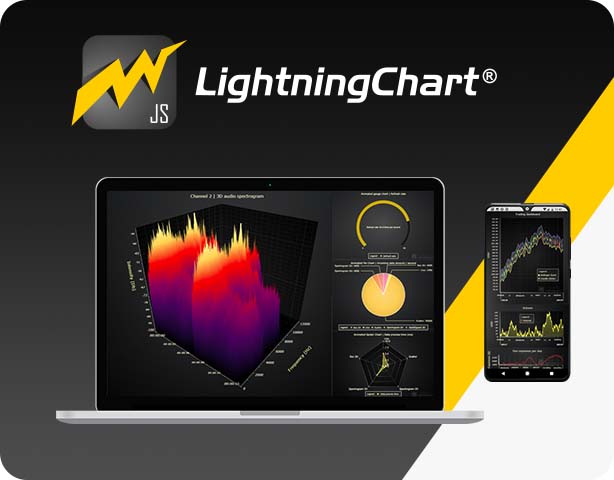
Vibration analysis charts to visualize data in real-time at the highest performance
LightningChart JS renders 100+ million data points and is fully compatible for data recorded via data loggers or processed in real-time via data acquisition devices.
Why integrate data visualization components into your Vibration Analysis application?
A vibration analysis software is used to calculate the vibration of machines and monitor their performance and possible anomalies.
By integrating high-performance charts into the web, mobile, or desktop applications, you’re assuring that incoming and logged vibration data can be displayed at the fastest visual representation without lag or delays for real-time processing.
Charting components are key in vibration software when visualizing patterns in data that help detect any issues or weaknesses in machinery and allow for preventive/corrective maintenance to improve productivity, save time, and reduce costs.
You are in good company
Get started with LightningChart Vibration Analysis Charts
Learn more about vibration analysis

TutorialCreate a vibration charts application with 2D & 3D spectrograms

ArticleWhat can vibration analysis detect?


If you have any questions, feel free to contact us!
©LightningChart Ltd 2026. All rights reserved.