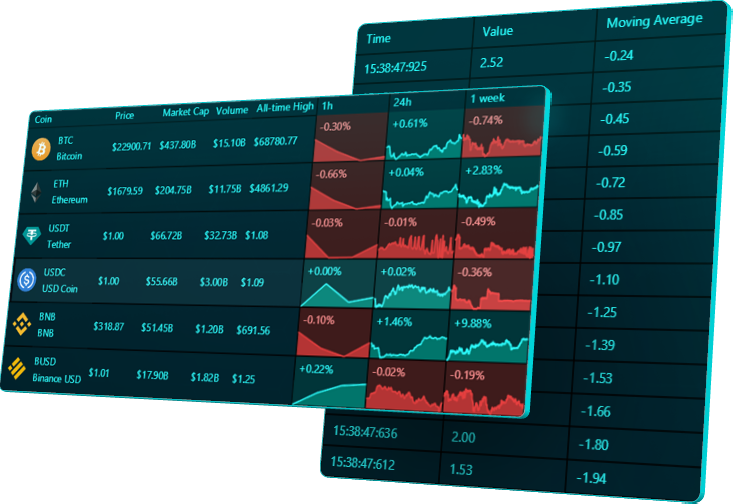
DataGrid Component
An additional grid control for LightningChart JS compatible with all library visualizations.

A top-level UI component
A limitless grid control
Supporting all types of content
Explore the features
Merging
The component features the ability to merge cells, providing an even more organized and efficient way to analyze and present data. This unique feature adds versatility to your data visualization process and takes your data analysis to the next level
Spark Charts
Effortlessly present and analyze large data sets with the in-cell DataGrid visualization options. Choose from a variety of chart types, including sparklines, area charts, bar charts, win-loss charts, and pie charts, to effectively display and understand your data on a smaller scale.
Fully customizable
Cell properties such as font, padding, or borders are fully customizable and can be individually assigned. This component has built-in functionalities for highlighting cells, rows, and columns.
Dynamic Coloring
Both cells and backgrounds support dynamic coloring based on data values. This enables the grid component to be used as a heatmap.
Event API
Add custom user-interactions to the DataGrid component based on users’ actions, such as activating a drilldown based on a mouse click or hover.
How to integrate DataGrid into my LightningChart JS app?
The grid component is a fast, advanced, and highly-customizable tool for a more detailed data analysis that supports a wide variety of content formats and in-cell visualizations.
You can use the DataGrid component as an add-on to LightningChart JS v.4.0 or higher. To use DataGrid, you will need to purchase a license.
You can always test the DataGrid component before purchasing. To do so, please visit our Interactive Examples.

