


The Original, World's Fastest GPU-Accelerated Charts & Dashboards Since 2007
Run light-weight dashboard Run extreme dashboard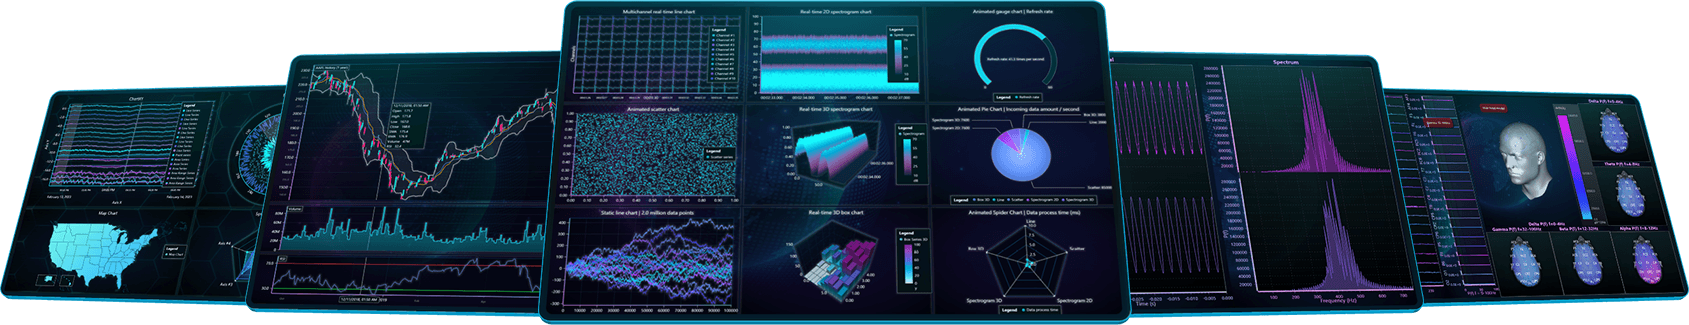
The Original, World's Fastest GPU-Accelerated Charts & Dashboards Since 2007


The Original, World's Fastest GPU-Accelerated Charts & Dashboards Since 2007


Next-generation charting apps are built with LightningChart
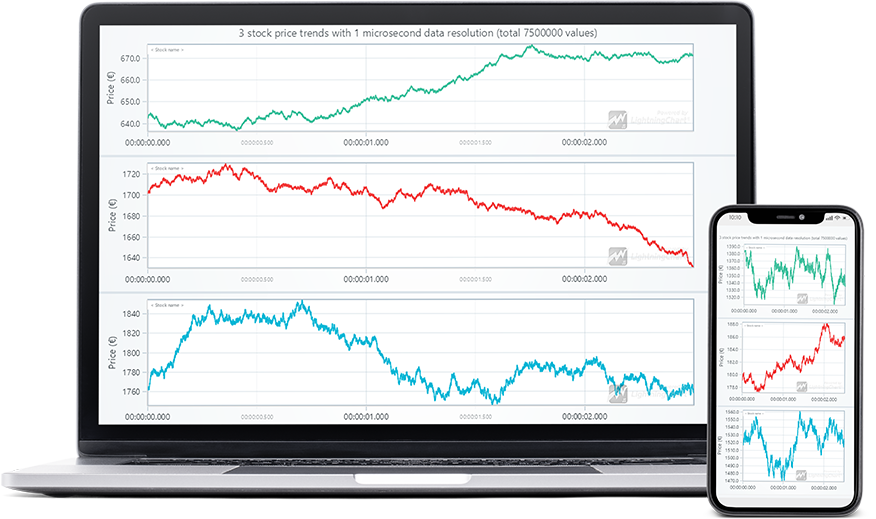
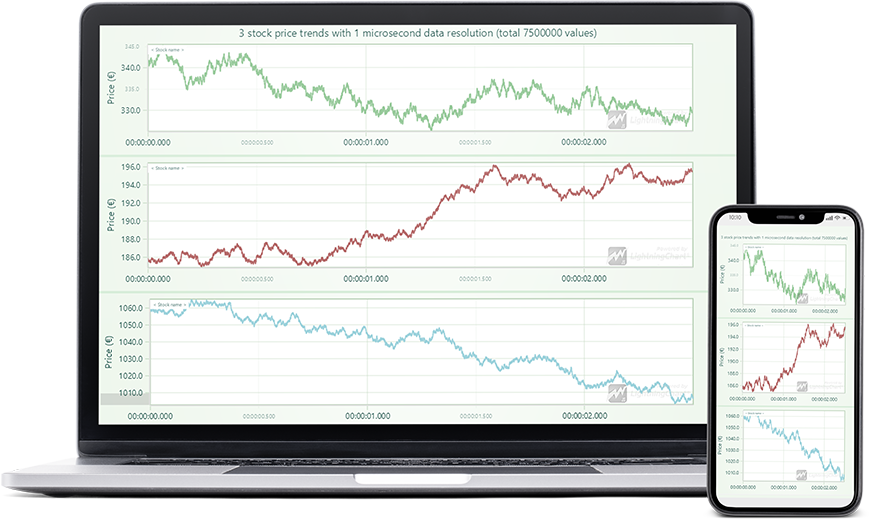
LightningChart is the most powerful high-performance charts framework ready to fulfill any performance requirement.
Develop real-time and demanding data visualization applications thousands of times more powerful than any other charting library.
Run light-weight dashboard Run extreme dashboard


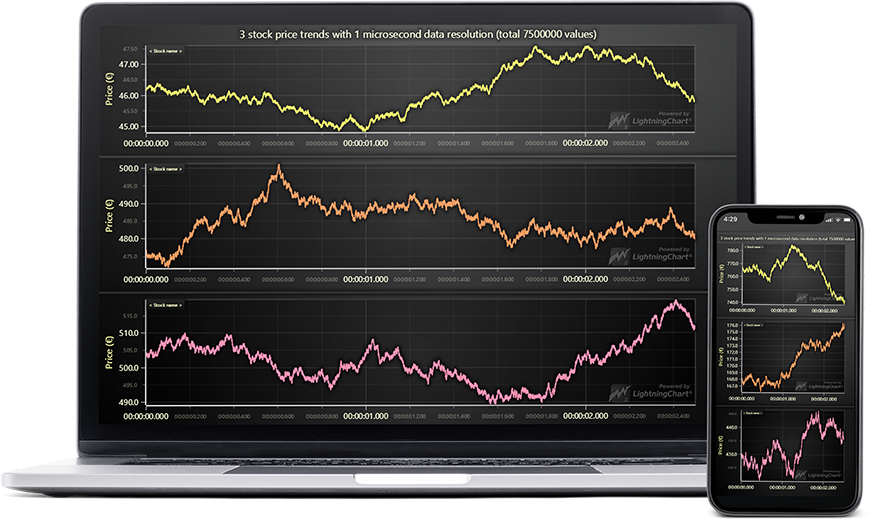
Modern & cross-platform app development
( { theme. )
Integrate beautiful high-performance charts and dashboards into web, mobile, cloud, desktop, server, IoT, and intranet applications.
Faster development using our 10+ project templates available.
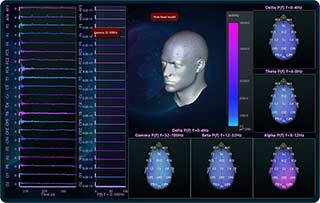
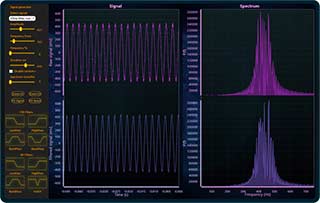
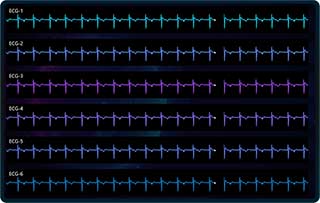
Beautiful data visualizations
Use LightningChart high-performance charts components as standalone dashboards or integrate them to users applications.
Adjust themes, colors, and features to your liking with fully customizable charts without compromising performance.
See More ChartsWhy performance matters in data visualization?
High-performance guarantees faster and more efficient components and applications.
The secret of LightningChart high-performance charts components is hardware-accelerated visualizations that unlock larger processing power and better user experiences made for intensive real-time applications.
Graphics technologies
LightningChart JS and .NET use the latest WebGL and DirectX technologies, respectively.
WebGL and DirectX technologies secure that applications will redraw and update graphics at lightning speeds, handle more data, and reduce the computing power requirements.
Benefits of GPU-acceleration
LightningChart high-performance charts components offload the heaviest computations to GPU's, which are relatively much more powerful than CPU's.
LightningChart’s visualization controls are GPU-accelerated charts rendered at the highest FPS and fastest load-up speeds.

Most popular .NET charting control
in Visual Studio Marketplace
25,000
TIMES INSTALLED

LightningChart .NET
visualizes up to
1,000,000,000,000
DATA POINTS

LightningChart JS
visualizes up to
2,000,000,000
DATA POINTS

More than
200 VISUALIZATION EXAMPLES
Up to
1,000,000 TIMES FASTERTHAN OTHER LIBRARIES
We build Lightning Chart into our core product iTest - for the last 10 years. All of the high-end time series and X-Y charts are with this component. The component works well and is stable - our system can be running… Read more

At Raylase we have been using LightningChart to visualize data and results from a number of applications: calibrations, data analysis, pattern preview... We need a tool that is fast, versatile and easy to use, so we can… Read more

We’ve been using LightningChart for over 5 years now in both Visual Basic and C# projects, starting with .NET 4.5 and now with .NET 8.0. It performs very smoothly, even when plotting over 50 series of real-time acquisition… Read more

I use LightningChart in a WPF/C# application and appreciate how easy it is to use while delivering high-performance, dynamic, and interactive visualizations with minimal setup and excellent rendering speed. Read more

Using Lightning Charts in a C#/WPF environment enabled us to display up to 800k datapoints per second per XY-Graph (up to 4 in parallel so far) in real time without requiring high performance hardware. The integration was… Read more

It was very user friendly and helped me a lot when using the ready to deploy chart especially the polar plot. Would recommend it for use in serious application development. Read more

The excellent out of the box functionality of LightningChart in combination with great UWP support helped me to quickly develop a platform independent user interface for GRBL CNC machining. LightningChart enabled me to… Read more

We use Lightning Charts in a C#/WPF environment. Mainly XY, Polar, and 3d views. Our charting requirements can sometimes be very data intense. We benchmarked Lightning Charts and other 3rd party charting libraries… Read more

The chart function is quite powerful, the image display effect is very good, and the communication efficiency of technical support personnel is very high. Read more


Get started
LightningСhart JS
Best for developing web, mobile, desktop, IoT, Cloud, & Intranet applications that require fast data processing times.
The library features 100+ charts, examples source code, & 10+ framework templates including Angular, React, Quasar JS, Ionic, etc.
WebGL-rendered, GPU-accelerated charts for delivering the highest performance & the best user experience.
LightningСhart .NET
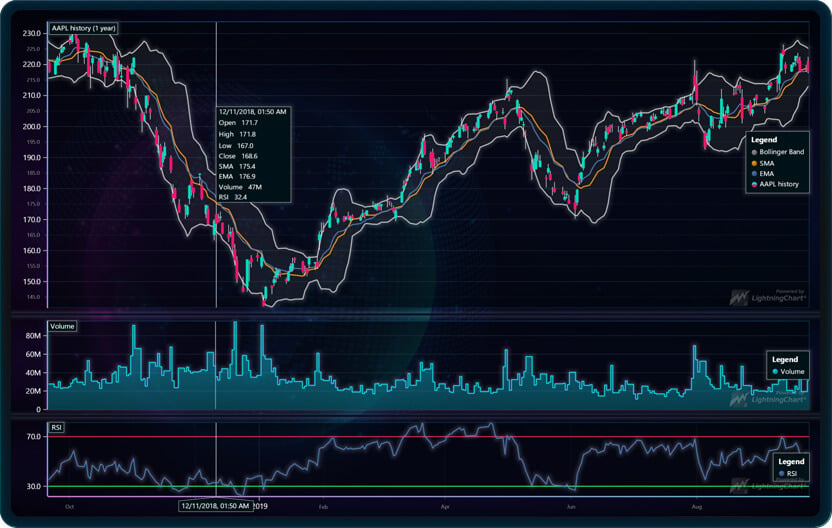
Ideal for developing highly demanding desktop applications, e.g., scientific, engineering, finance, medicine, etc.
The library features 100+ chart types, signal tools, and examples source code supported in WinForms, UWP, and WPF.
Hardware-accelerated charting controls for lightning-fast rendering performance and efficient use of resources
LightningСhart Python
For data scientists or educators looking an advanced data analysis library.
Featuring 100+ plot types, compatible with different Python notebooks. Supports PyQt & PySide integration.
High-performance WebGL-rendered, GPU-accelerated 2D & 3D plotting library
Dashtera Dashboards
No-code, GPU-accelerated platform for building real-time dashboards and high-performance data analytics in minutes.
Connect to databases, files, APIs, and live data sources with fast, flexible no-code integrations.
Automate real-time insights with interactive dashboards, live updates, and shareable analytics—no code required.
Read our success stories
Husqvarna AB
Husqvarna has developed a software tool that measures real-time log data from the outdoor power tools’ motors and displays it in a chart using LightningChart high-performance charts.
Müller BBM-VAS
The PAK cloud services provide an infrastructure that enables data management across multiple data sources and applications, specifically designed to capture dynamic and physical data.
SES S.A.
SES is working on developing a satellite telemetry web application featuring high-performance charts and data visualizations. This innovation will be used in SES satellite network operations center for controlling satellites and conveying offline historical data analysis.


If you have any questions, feel free to contact us!
©LightningChart Ltd 2026. All rights reserved.