Instrumentation Charts
Build the most powerful industrial instumentation applications with LightningChart high-performance charting components
Instrumentation charts for creating custom test and measurement signal analyzers
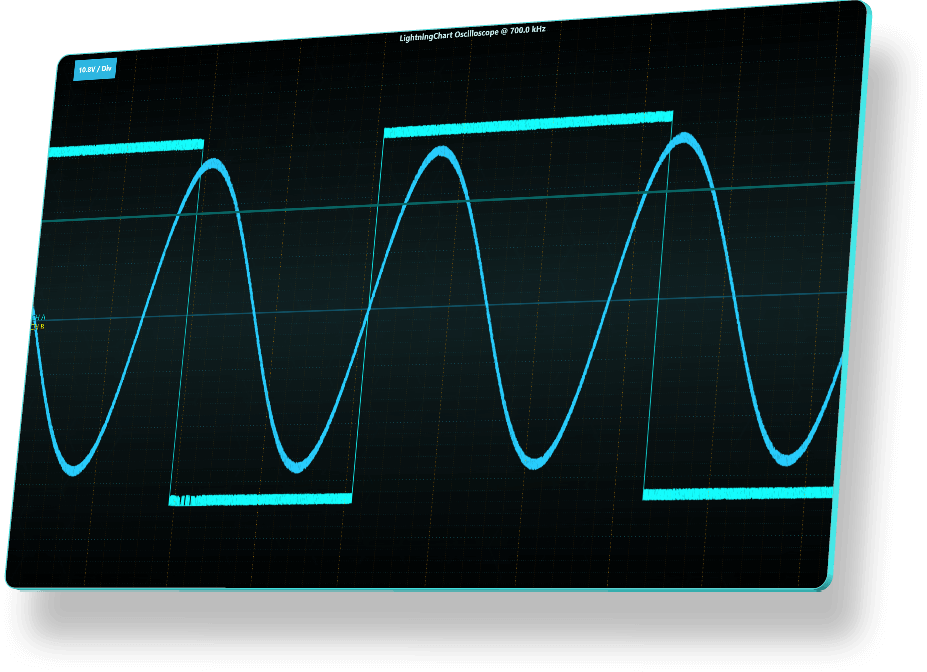
Create electronic test and measurement engineering and scientific instruments to analyze and visualize signals such as oscilloscopes and spectrum analyzers.
.NET trading apps that support advanced technical analysis
LightningChart comes with signal waveform displays, eye-patterns, and persistent signal waveforms with memory. It has scrolling /sweeping / stepping XY signal charts and level triggering.
LightningChart comes with signal waveform displays, eye-patterns, and persistent signal waveforms with memory. It has scrolling /sweeping / stepping XY signal charts and level triggering.
Develop high-performance cross-platform applications with LightningChart JS components
LightningChart JS features hundreds of high-performance charting components including real-time data monitoring and XY series.
How can LightningChart instrumentation charts build powerful apps?
High performance in charting components is essential when observing time-varying signals, analyzing waveform characteristics, or analyzing signals’ frequencies.
LightningChart components excel at processing massive amounts of stream data while efficiently managing CPU resources.
This translates into the highest processing power at the lowest energy consumption levels, which also saves energy and reduces costs.


