


Blog
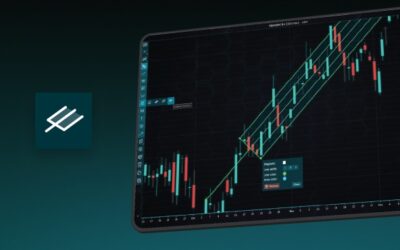
Andrews’ Pitchfork in Technical Analysis
Andrews' Pitchfork is one of the most respected technical analysis tools used by traders to identify potential support and resistance levels, trend direction, and future price paths. Developed by Dr. Alan H. Andrews, the indicator is based on the principle that prices tend to gravitate toward a median line while oscillating within parallel trend...

React Charting Performance
Here's a scenario that plays out across development teams every few months. Someone builds a React dashboard, picks Recharts or Victory because they're popular, the devs love them, and the first demo looks great. Then the dataset gets bigger. Or the data starts streaming. And one day a user on production opens the dashboard and the browser tab...

Javascript Charting Library comparison 2026
Every year someone publishes a listicle of JavaScript charting libraries. They screenshot a demo, note the GitHub stars, paste in the npm install command, and call it a day. Then you follow their recommendation, get six months into your project, and discover that your dashboard freezes solid the moment a real user connects a real dataset. This...

Visualizing 10 Million Data Points in the Browser (2026): The Technical Deep-Dive
Ten Million Data Points in the Browser: How WebGL Makes Mass Datasets Interactive Ten million data points. That number used to mean a database problem, not a front-end problem. Now research teams want to explore it interactively in a browser. Trading desks want tick-by-tick history without pre-aggregation. IoT platforms want every sensor reading...
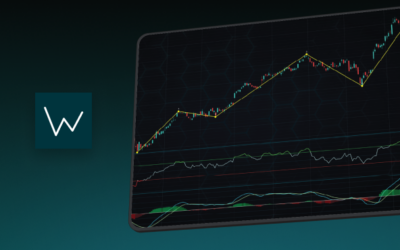
Elliott Wave Theory in Trading
Financial markets often appear chaotic, but many traders believe that price movements follow recurring patterns driven by human psychology. One of the most influential approaches based on this idea is the Elliott Wave Theory. Developed nearly a century ago, it remains one of the most widely studied methods of technical analysis.
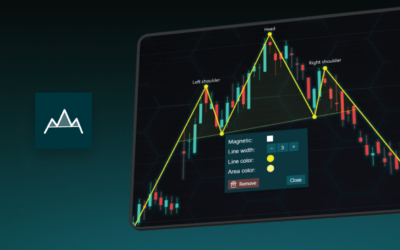
The Head and Shoulders Pattern in Technical Analysis
The Head and Shoulders Pattern in Technical Analysis The Head and Shoulders Pattern in Technical Analysis The Head and Shoulders pattern is one of the most recognized and widely used chart patterns in technical analysis. It is considered a reliable reversal pattern that helps traders identify potential changes in market...

Best Telerik Charts Alternative in 2026: GPU Performance for WPF, WinForms, and Web
Telerik from Progress is a comprehensive UI component suite covering WPF, WinForms, ASP.NET, Blazor, and JavaScript. The charting components: RadChartView for WPF and WinForms, and Kendo UI Charts for web and Blazor, arrive bundled with the suite purchase. For teams already invested in the Telerik ecosystem for grids, form controls, and...

Streaming Data Visualization with WebSockets (2026): The Complete Tutorial
Every WebSocket tutorial on the internet shows the same thing: a server sends a random number every second, a chart updates. It works. The demo looks great. Then you deploy to production, your IoT sensors push 800 updates per second across twelve channels, and the browser tab quietly consumes 1.4GB of RAM before dying. This tutorial is written...

Best ScottPlot Alternative in 2026: GPU Rendering, 3D Charts, Cross-Language Support
ScottPlot is genuinely excellent for what it is: a free, MIT-licensed, actively developed .NET plotting library with an honest focus on interactive large-dataset display. The GDI+ rasterized renderer — which draws the entire chart as a pixel bitmap rather than managing per-point rendering primitives — handles data volumes meaningfully better than...
Using Fibonacci Tools in Trading: A Practical Guide for Market Analysis
Using Fibonacci Tools in Trading: A Practical Guide for Market AnalysisTechnical traders rely on various tools to identify potential support, resistance, and price targets. Among the most widely used are Fibonacci tools, which are based on the mathematical sequence discovered by Leonardo Fibonacci in the 13th century. While the Fibonacci sequence...


If you have any questions, feel free to contact us!
©LightningChart Ltd 2026. All rights reserved.