Date of case study: 01/2024Industry of business: AutomotiveEstablished: 2013LightningChart solution: XY ChartsJU Solar...


Date of case study: 01/2024Industry of business: AutomotiveEstablished: 2013LightningChart solution: XY ChartsJU Solar...
LightningChart .NET compatible with .NET 8.0 - video updateAn update on LightningChart .NET's compatibility with the...
Happy Holidays from It’s a been a very busy year for LightningChart, and we’d like to thank all the customers and...
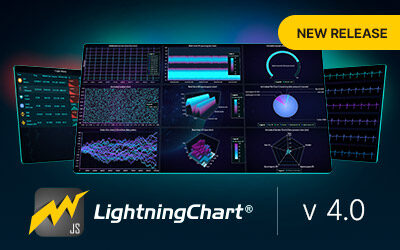
LightningChart JS v.4.0.0 has been released!Beautiful charts, introducing the DataGrid component, new color Themes,...
LightningChart .NET: Changes in pricing on January 18th, 2023From January 18th, 2023, we will be adjusting our prices...

Christmas tree developed with LightningChart® JSHappy Holidays!This Holiday Season, we find ourselves reflecting on...

JavaScript Refreshing Spectrum Chart Hello again! This time I bring a quick but helpful tutorial on how to...
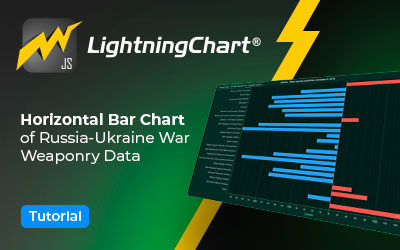
JavaScript Horizontal Bar Chart In this article, we aim to respectfully create a JavaScript horizontal bar chart that...

JS Spectrogram ApplicationHello, in this article we will create a JS dashboard with 2D and 3D spectrogram charts. The...

Beginning Ionic App Development with Capacitor, Angular & LightningChart JS [This is the second part of the...
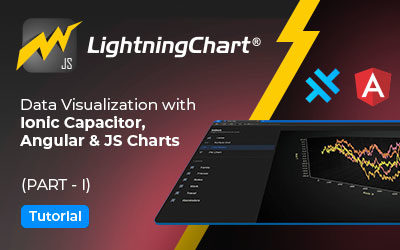
Building mobile Ionic chart applications with Ionic Capacitor This is the first part of the article “Data...

JavaScript Pie Chart with NodeJS & TypeScript Today, we are going to do a short tutorial on how to generate...