




LightningChart .NET v.10.4.1 has been released!
New features, new custom controls, & performance improvements
DataCursor: new feature for automated data tracking in the chart.
In previous versions, LightningChart .NET provided different tools to implement the data tracking functionality but these required some extra coding by the user.
Now, all the ViewXY series can be explored using DataCursor. This is a new class/object that shows the series data value at or near the mouse position.
The DataCursor class consists of X&Y axis labels, a result table, a color bar, and haircross lines. Each individual item of the DataCursor can be configured.
To avoid any backward compatibility breaks, the visible property of the DataCursor is disabled by default. Each XY series has the CursorTrackEnabled property to control the DataCursor automated tracking on it.
In future updates, other views including 3D, Polar, and Smith will have a similar DataCursor feature.
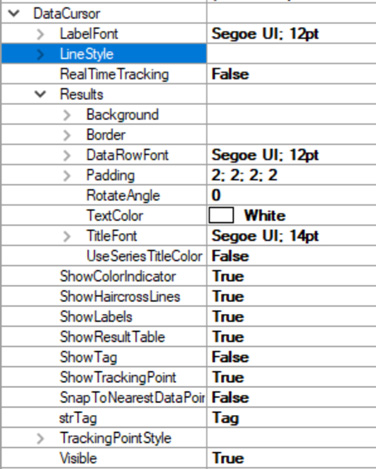
Table of public properties

DataCursor with line series
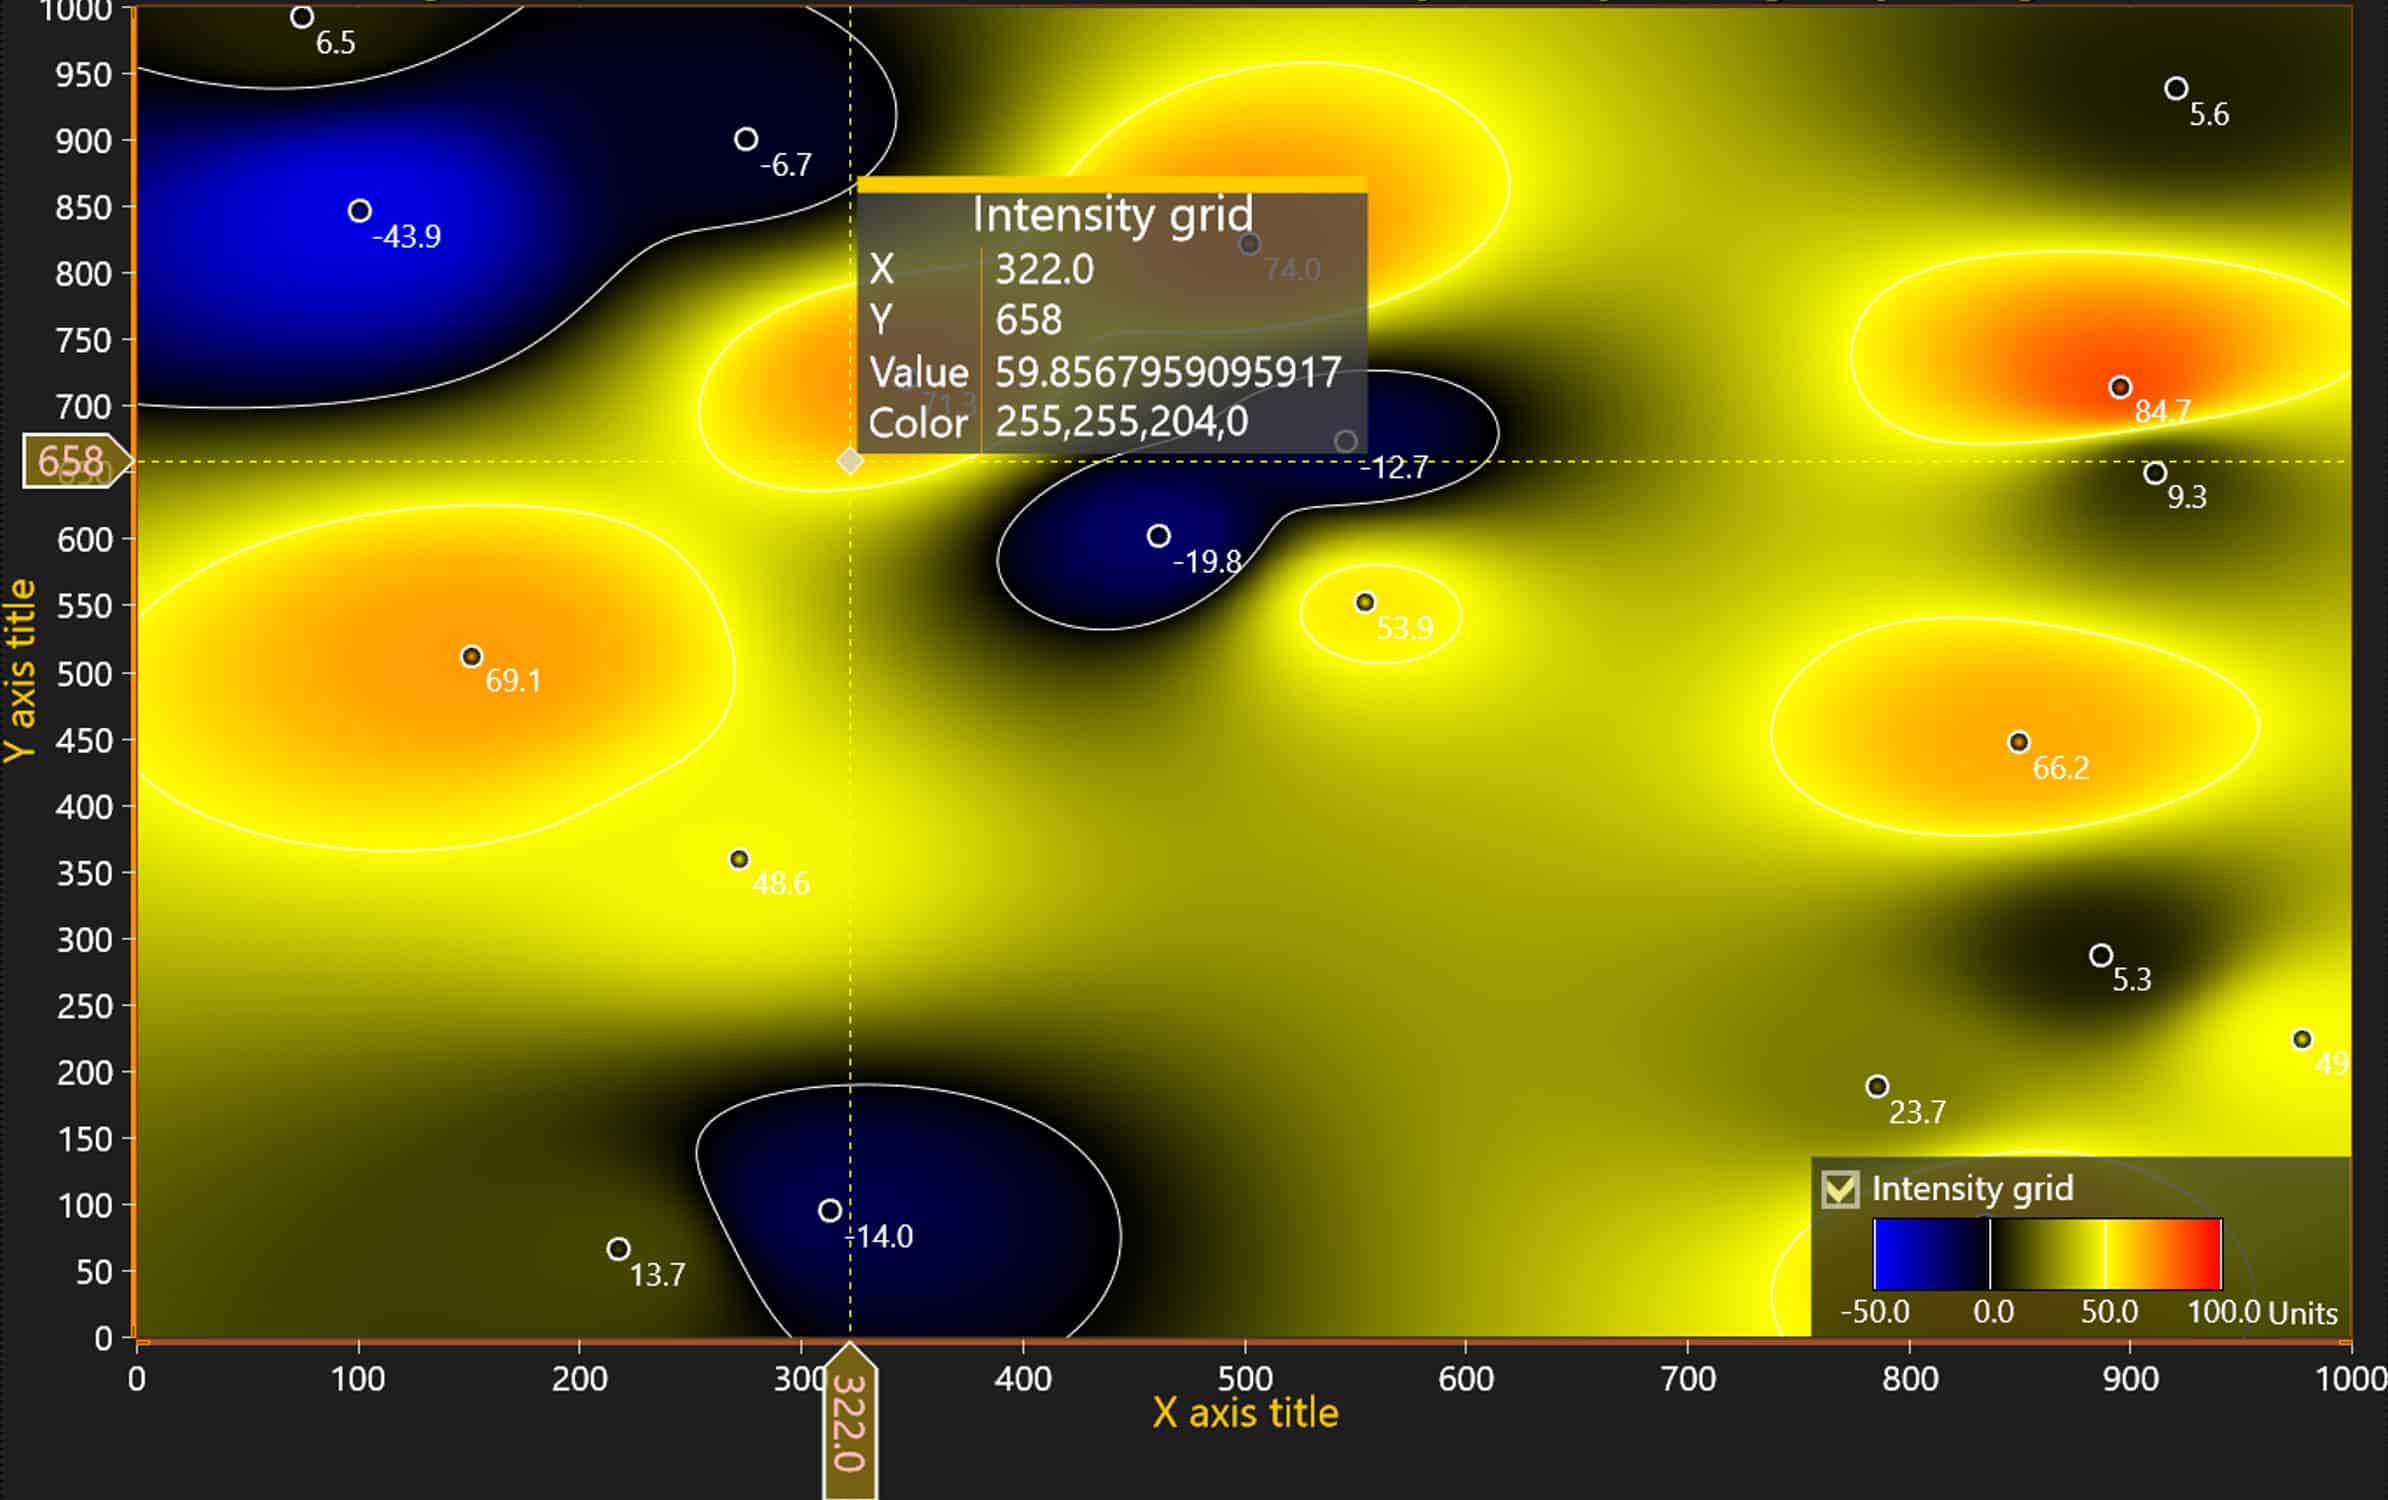
DataCursor with intensity series
New built-in user/custom controls
Zoom bar
The ZoomBar custom control can be added to the application layout (grid, panel) as well as to the main Chart (XY). All the data from the reference Chart is then copied to the ZoomBar control which has a band/bar to select the X-axis region to be zoomed in from the main(reference) Chart.
The ZoomBar control has several configuration options available. You can see a demo of the usage of this control at our Interactive Examples App > ExampleClipAreas, ExampleRealTimeZoomBar, and ExampleRealTimeZoomBarScrollable.
Notice that currently, the control is only available for non-bindable WPF and WinForms.
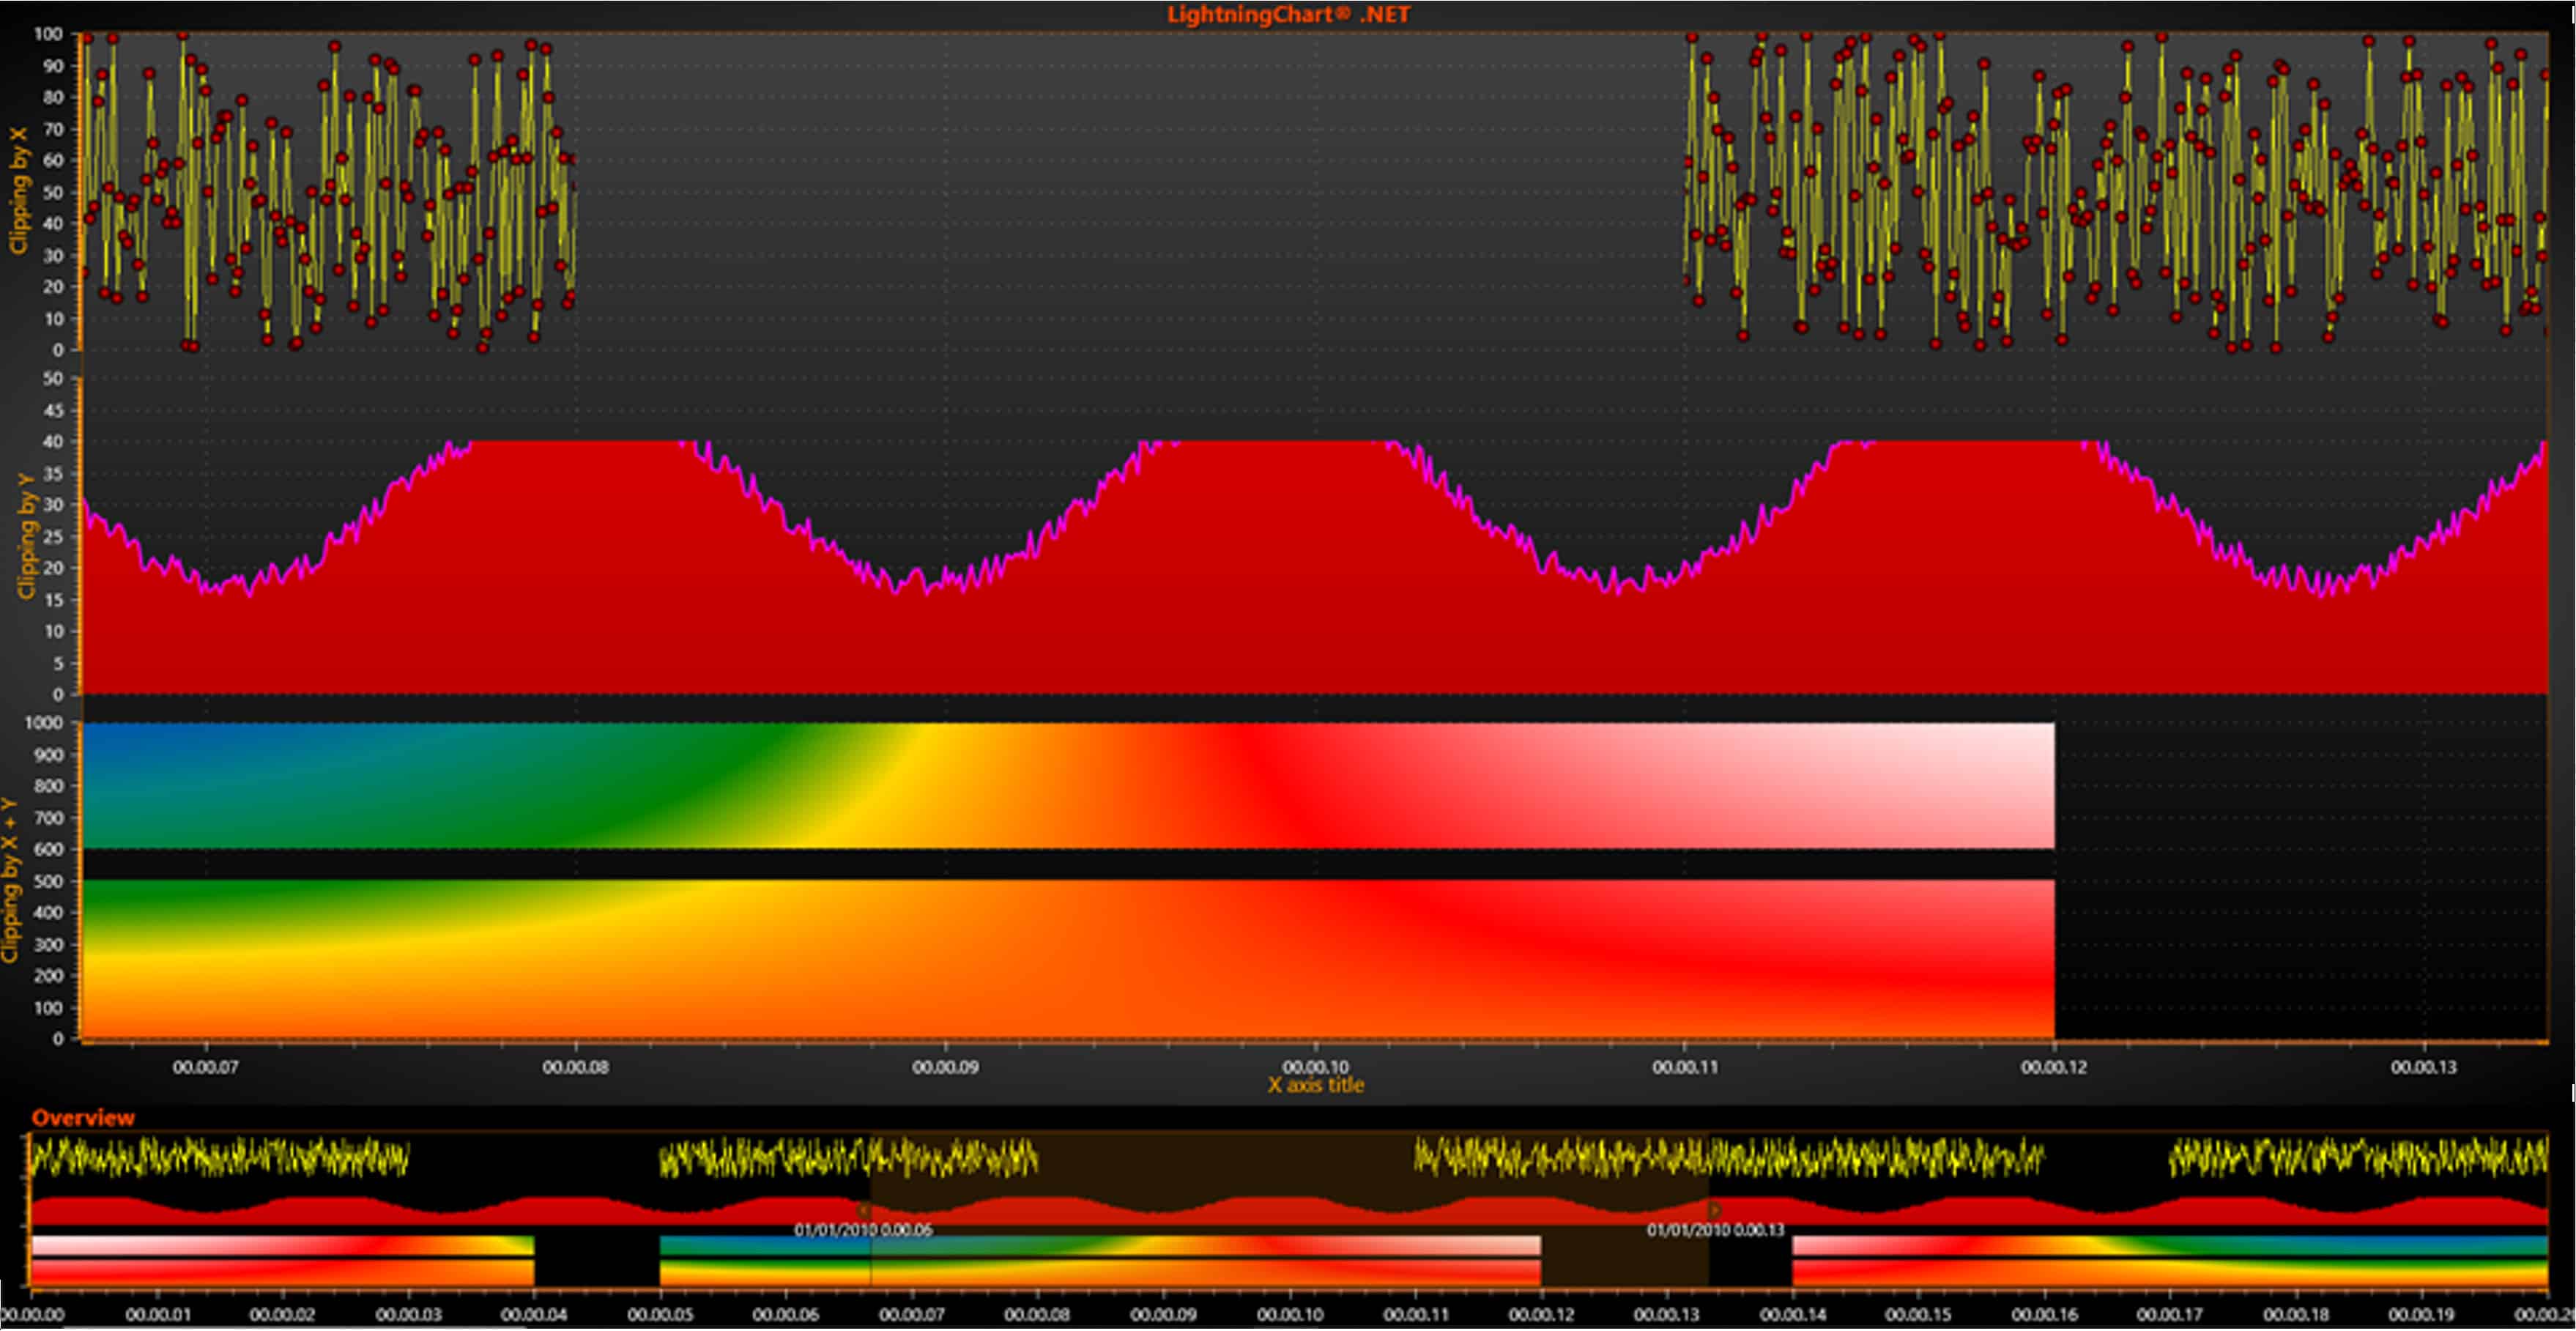
ZoomBar Control
ViolinPlot
We added a new chart type – Violin plot, a new type is user/custom control under LightningChart. Currently for non-bindable WPF only.
The demonstration of usage could be found in ExampleViolinPlot from our Interactive Examples App.
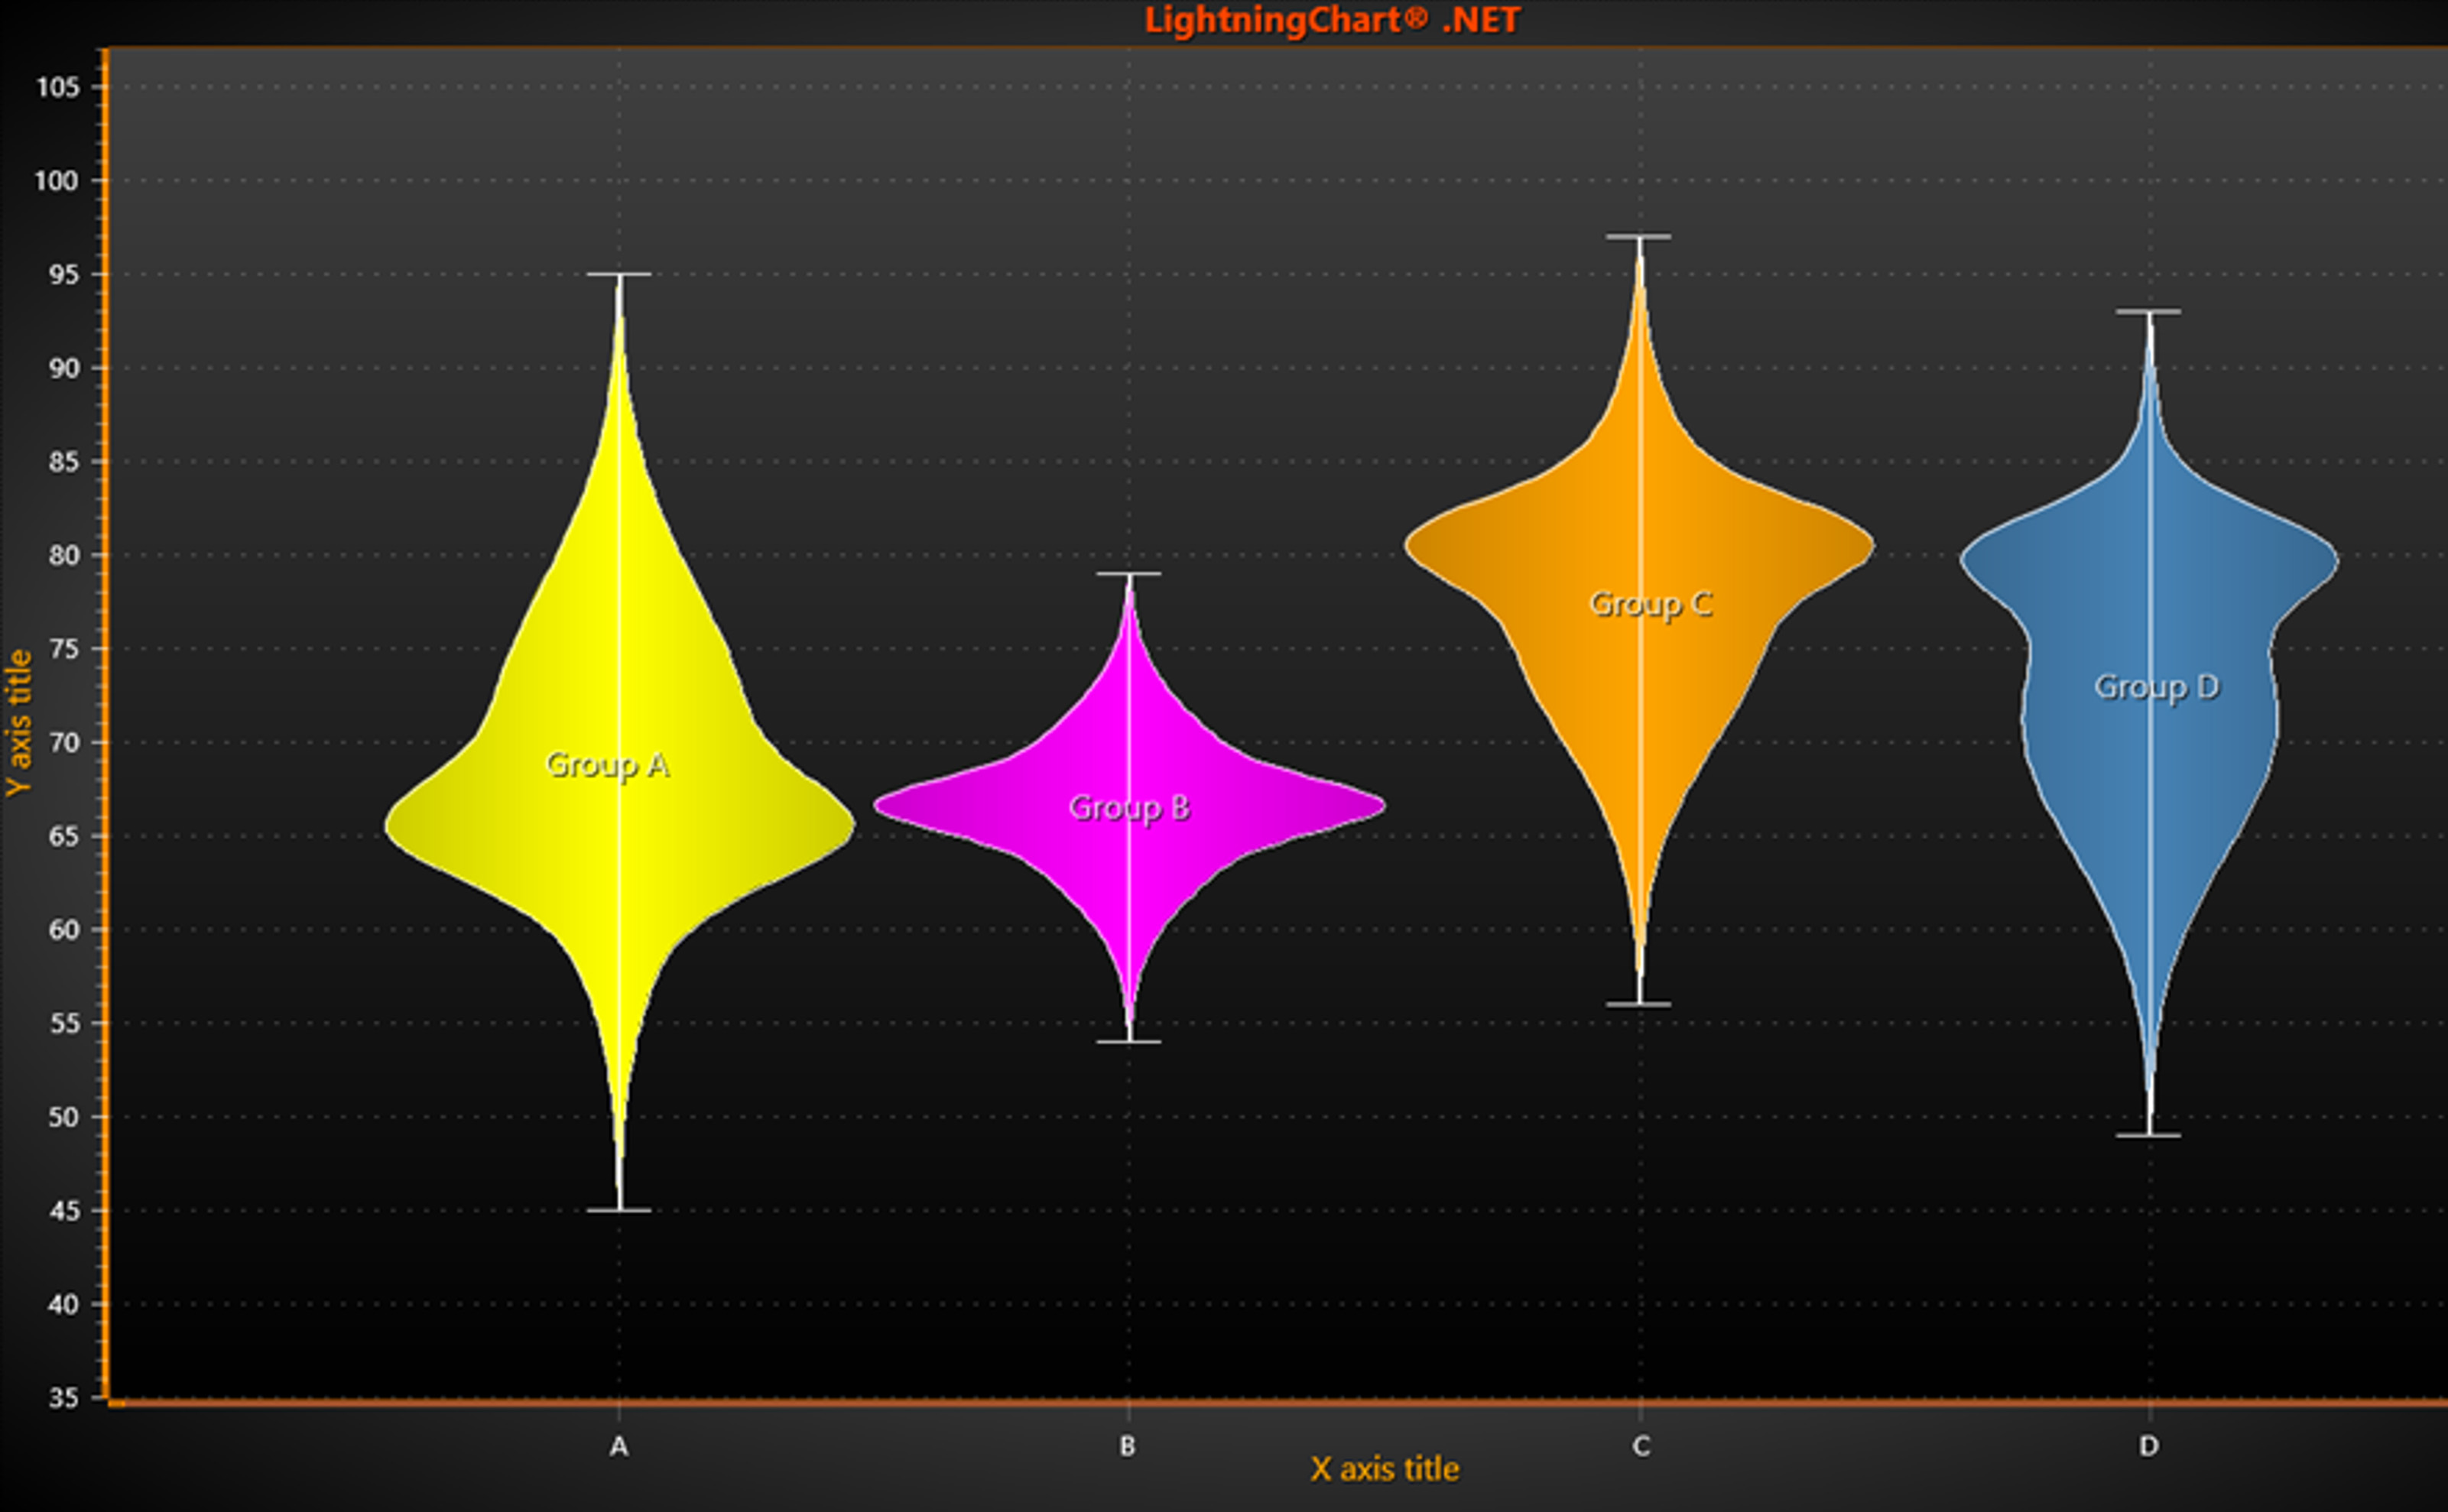
ViolinPlot Control
Force axis labels at both ends
In case the user needs to show the label at the minimum and maximum axis values, the EndPointLabelsVisible property should be enabled. This is particularly useful when the logarithmic axis is zoomed in.
The PreferEndPointLabelsOverNearbyMahjorTick property defines the number of major ticks that must be visible before the endpoint labels are hidden. (By default, -1 means the endpoint labels will be always visible).
If the Logarithmic axis Major Tick count <= EndPointMajorTickThreshold, then the label next to the minor tick may be shown.
In the following images on the left chart’s axis, you’ll notice the PreferEndPointLabelsOverNearbyMajorTick property is disabled. Contrarily, on the right-side chart’s axis this property is enabled.
On the left chart’s Y-axis, this is set to always show the end labels (EndPointLabelsVisible=true, EndPointMajorTickThreshold=-1). Meanwhile, on the right chart’s Y-axis, this is configured to show a minor tick in addition to a 1 major tick (EndPointLabelsVisible=true, EndPointMajorTickThreshold=1)
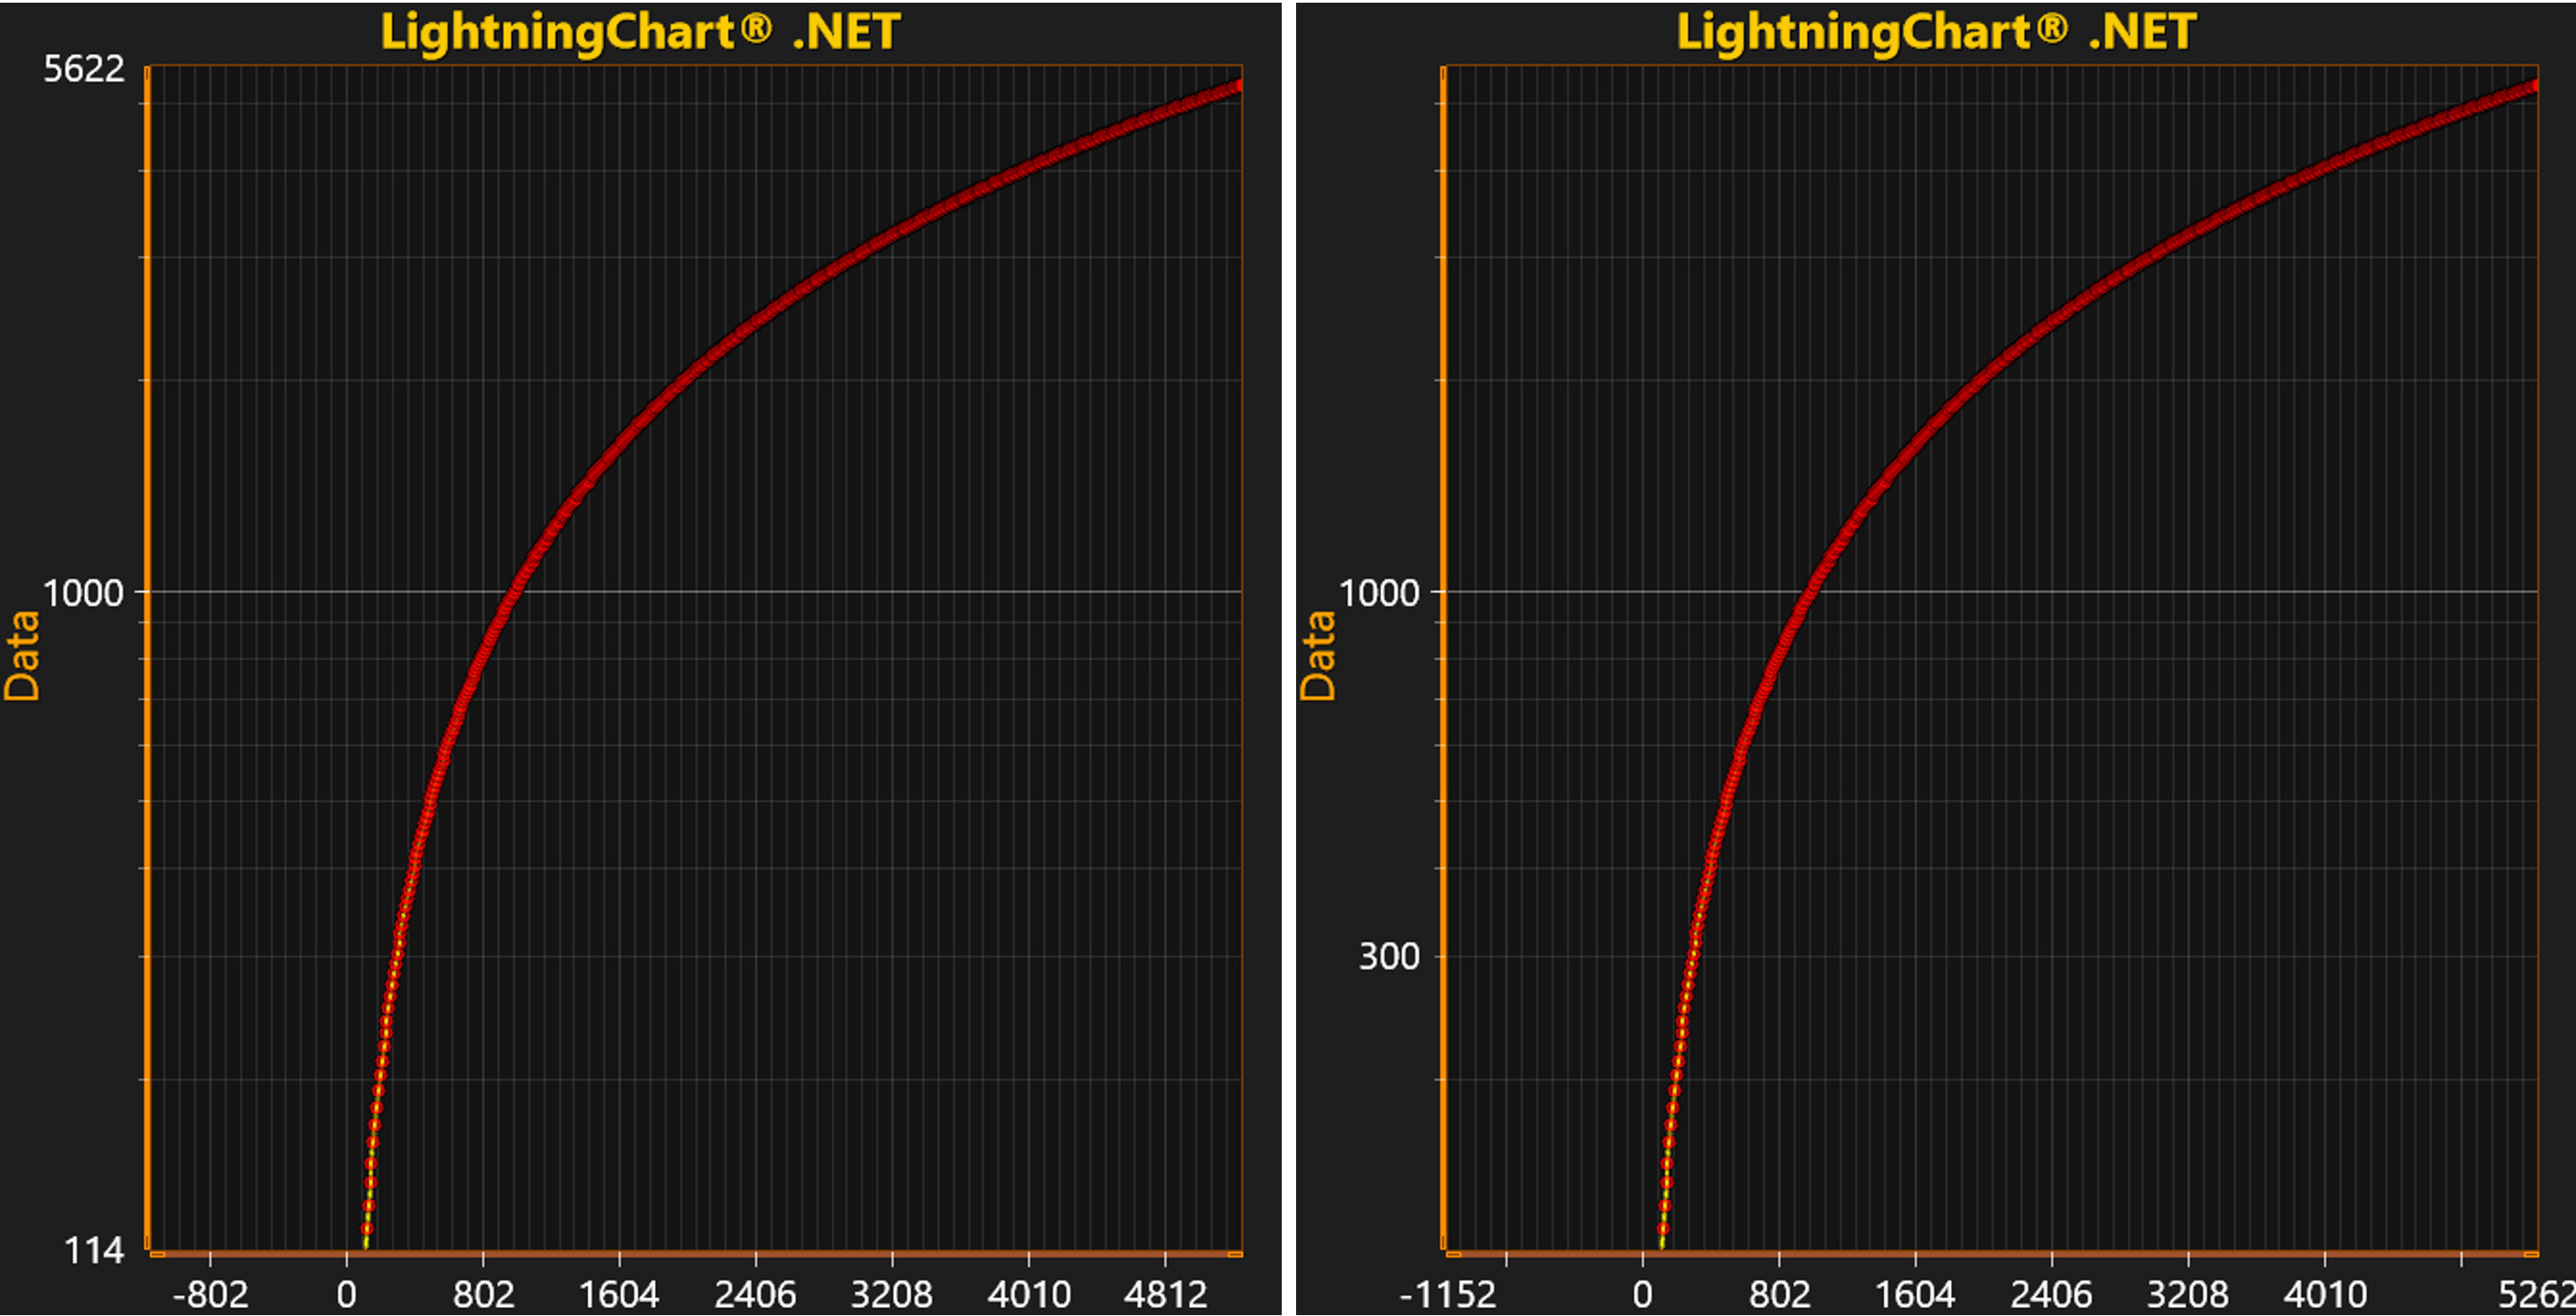
Force axis labels at both ends
New Signal Processing Component: Digital Filters
Two types of digital filters are added to LightningChart’s SignalTools: IIR and FIR filters. The user just needs to set factors for filters (SetABFactors() or SetFactors methods respectively) and the signal is ready to be filtered (FilterData() method call).
The demonstration of usage could be found in our Interactive Examples App: ExampleSignalFilters.

Raw, unfiltered signal on the top, filtered signal on the bottom.
Other Improvements
Improvements to the SVG format have been made. The application’s speed and memory usage are now improved when the chart is imported as SVG. The ClipArea is now applied for the Point symbol of the line series.
The ClipArea is now applied for the “new” block series. The clipping for the ClipAreas and GraphArea is now applied correctly. The Series-Title of the “new” block series shows now correctly in the SVG output.
We have also improved the performance when an XY or 3D axis has many CustomTicks.
Get started with LightningChart .NET v.10.4.1
See more news
LightningChart .NET v.12.6.1
LightningChart .NET v.12.6.1 is out now!Features of LightningChart® .NET version 12.6.1In this release we added new features, made several improvements and fixed dozens of errors. We upgraded target framework (from .NET 8.0 to 10.0), added Universal-Data-Parser...
Trend Lines in Trading
Trend lines are among the simplest yet most powerful tools in technical analysis. They help traders visualize market direction, identify potential support and resistance levels, and make more informed trading decisions. Despite their simplicity, trend lines remain a...
Announcement: Baumer as LightningChart customer
Enabling High-Performance Visualization of Industrial Sensor Data with LightningChartDiscover how Baumer uses LightningChart to configure and visualize data from a wide variety of industrial sensors and create responsive, data-rich visualization...
Best Python Charting Library in 2026
Python's charting ecosystem is large, overlapping, and regularly misunderstood. Most comparison guides stop at Matplotlib, Plotly, and Seaborn. This one goes further: it covers what happens when your datasets grow large, your update rates increase, or your chart types...



If you have any questions, feel free to contact us!





