Blog

Using Scale Breaks in Data Visualization

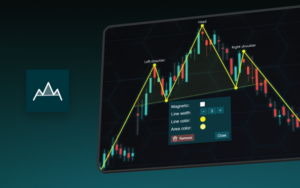
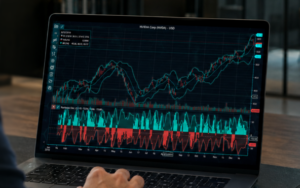
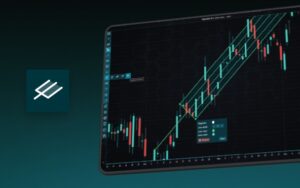
Using Scale Breaks in Data Visualization Starting from LightningChart® .NET version 8, X axes has supported Scale breaks. Scale breaks allow excluding specific X ranges, e.g. inactive trading hours/dates or machinery off-production hours. In effect, scale breaks allow you to visualize the data effectively on situations when part of the data is...

Lighting

This article covers basics of Lighting in Data Visualization.

logo lightningchart
Privacy Overview

This website uses cookies so that we can provide you with the best user experience possible. Cookie information is stored in your browser and performs functions such as recognising you when you return to our website and helping our team to understand which sections of the website you find most interesting and useful.