




The Head and Shoulders Pattern in Technical Analysis
The Head and Shoulders Pattern in Technical Analysis
The Head and Shoulders pattern is one of the most recognized and widely used chart patterns in technical analysis. It is considered a reliable reversal pattern that helps traders identify potential changes in market direction. Whether you’re trading stocks, forex, cryptocurrencies, or commodities, understanding this pattern can improve your ability to spot trend reversals and manage risk effectively.
This article explains what the Head and Shoulders pattern is, how it forms, how to trade it, and its advantages and limitations. We also take a look how to use the pattern in one of the technical analysis platforms available, LightningChart JS Trader.
The Pattern
The Head and Shoulders pattern is a bearish reversal pattern that typically appears after an extended uptrend. It signals that buying momentum is weakening and that sellers may soon take control.
The pattern consists of four main components:
- Left Shoulder: The price rises to a peak and then declines.
- Head: The price climbs to a higher peak before falling again.
- Right Shoulder: The price rises once more but fails to reach the height of the head, indicating weakening buying pressure.
- Neckline: A support line connecting the two troughs formed between the shoulders and the head.
Once the price breaks below the neckline, the pattern is generally considered complete.
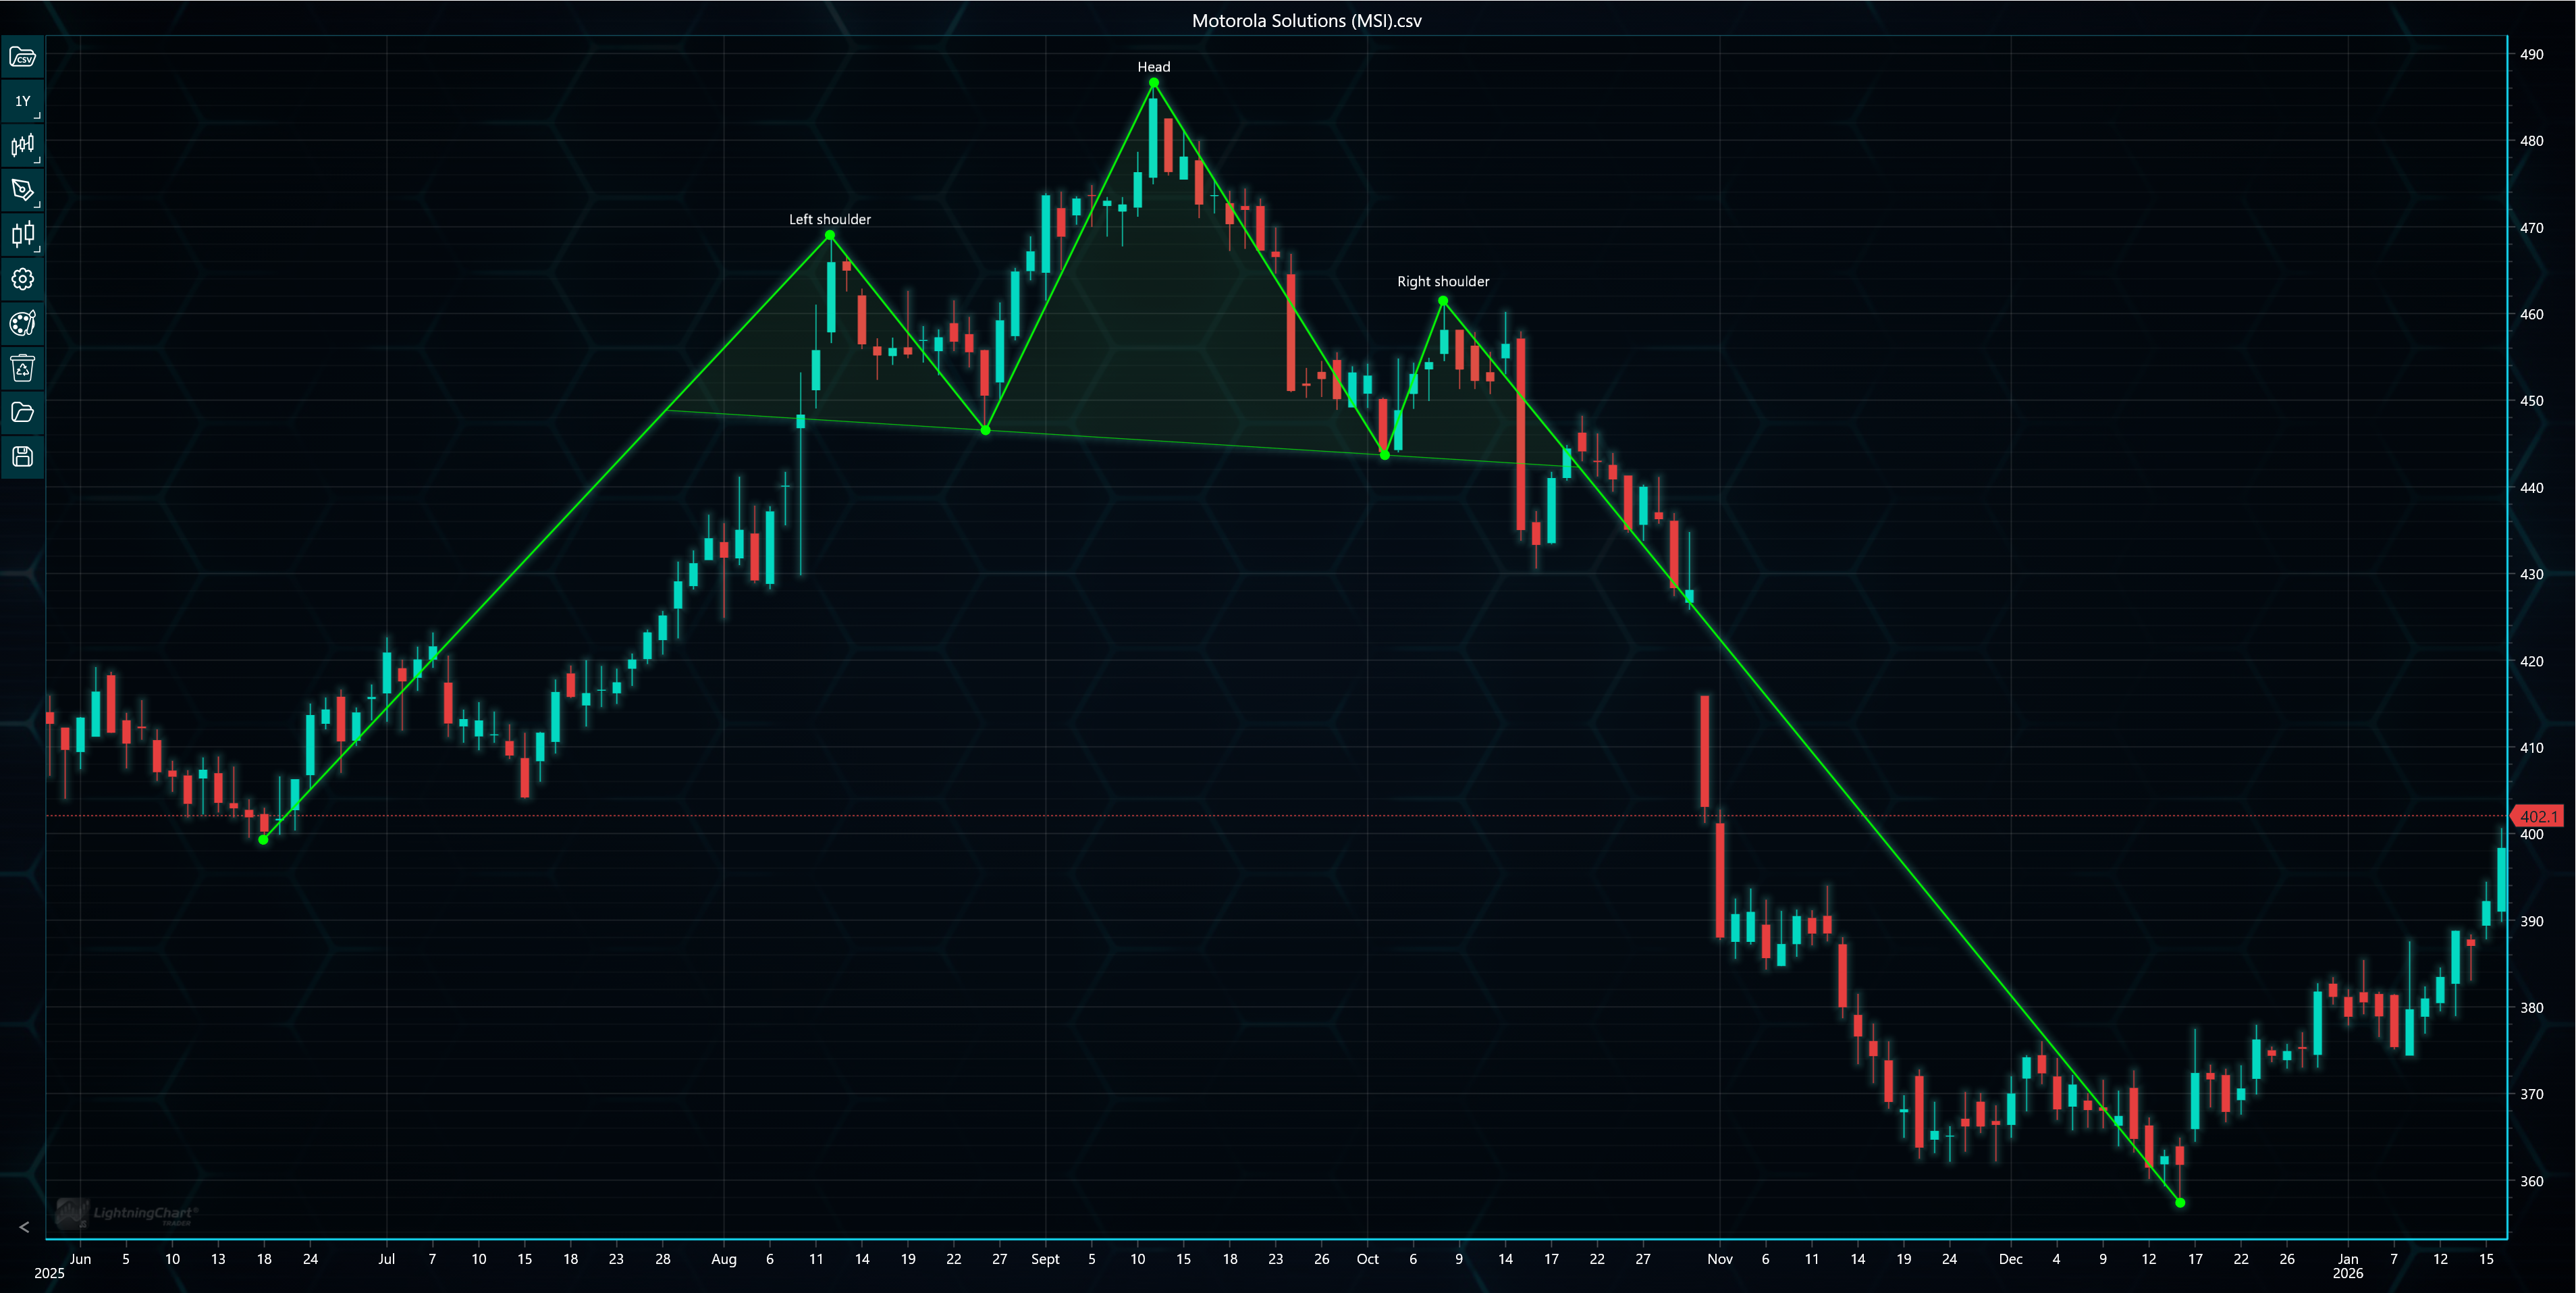
Head and Shoulders pattern in LightningChart JS Trader, with clearly visible shoulder and head peaks, followed by a downtrend.
The opposite formation, the Inverse Head and Shoulders, is also possible. It is a bullish reversal pattern, where a breakout above the neckline suggests that buyers have regained control and an upward trend may begin.
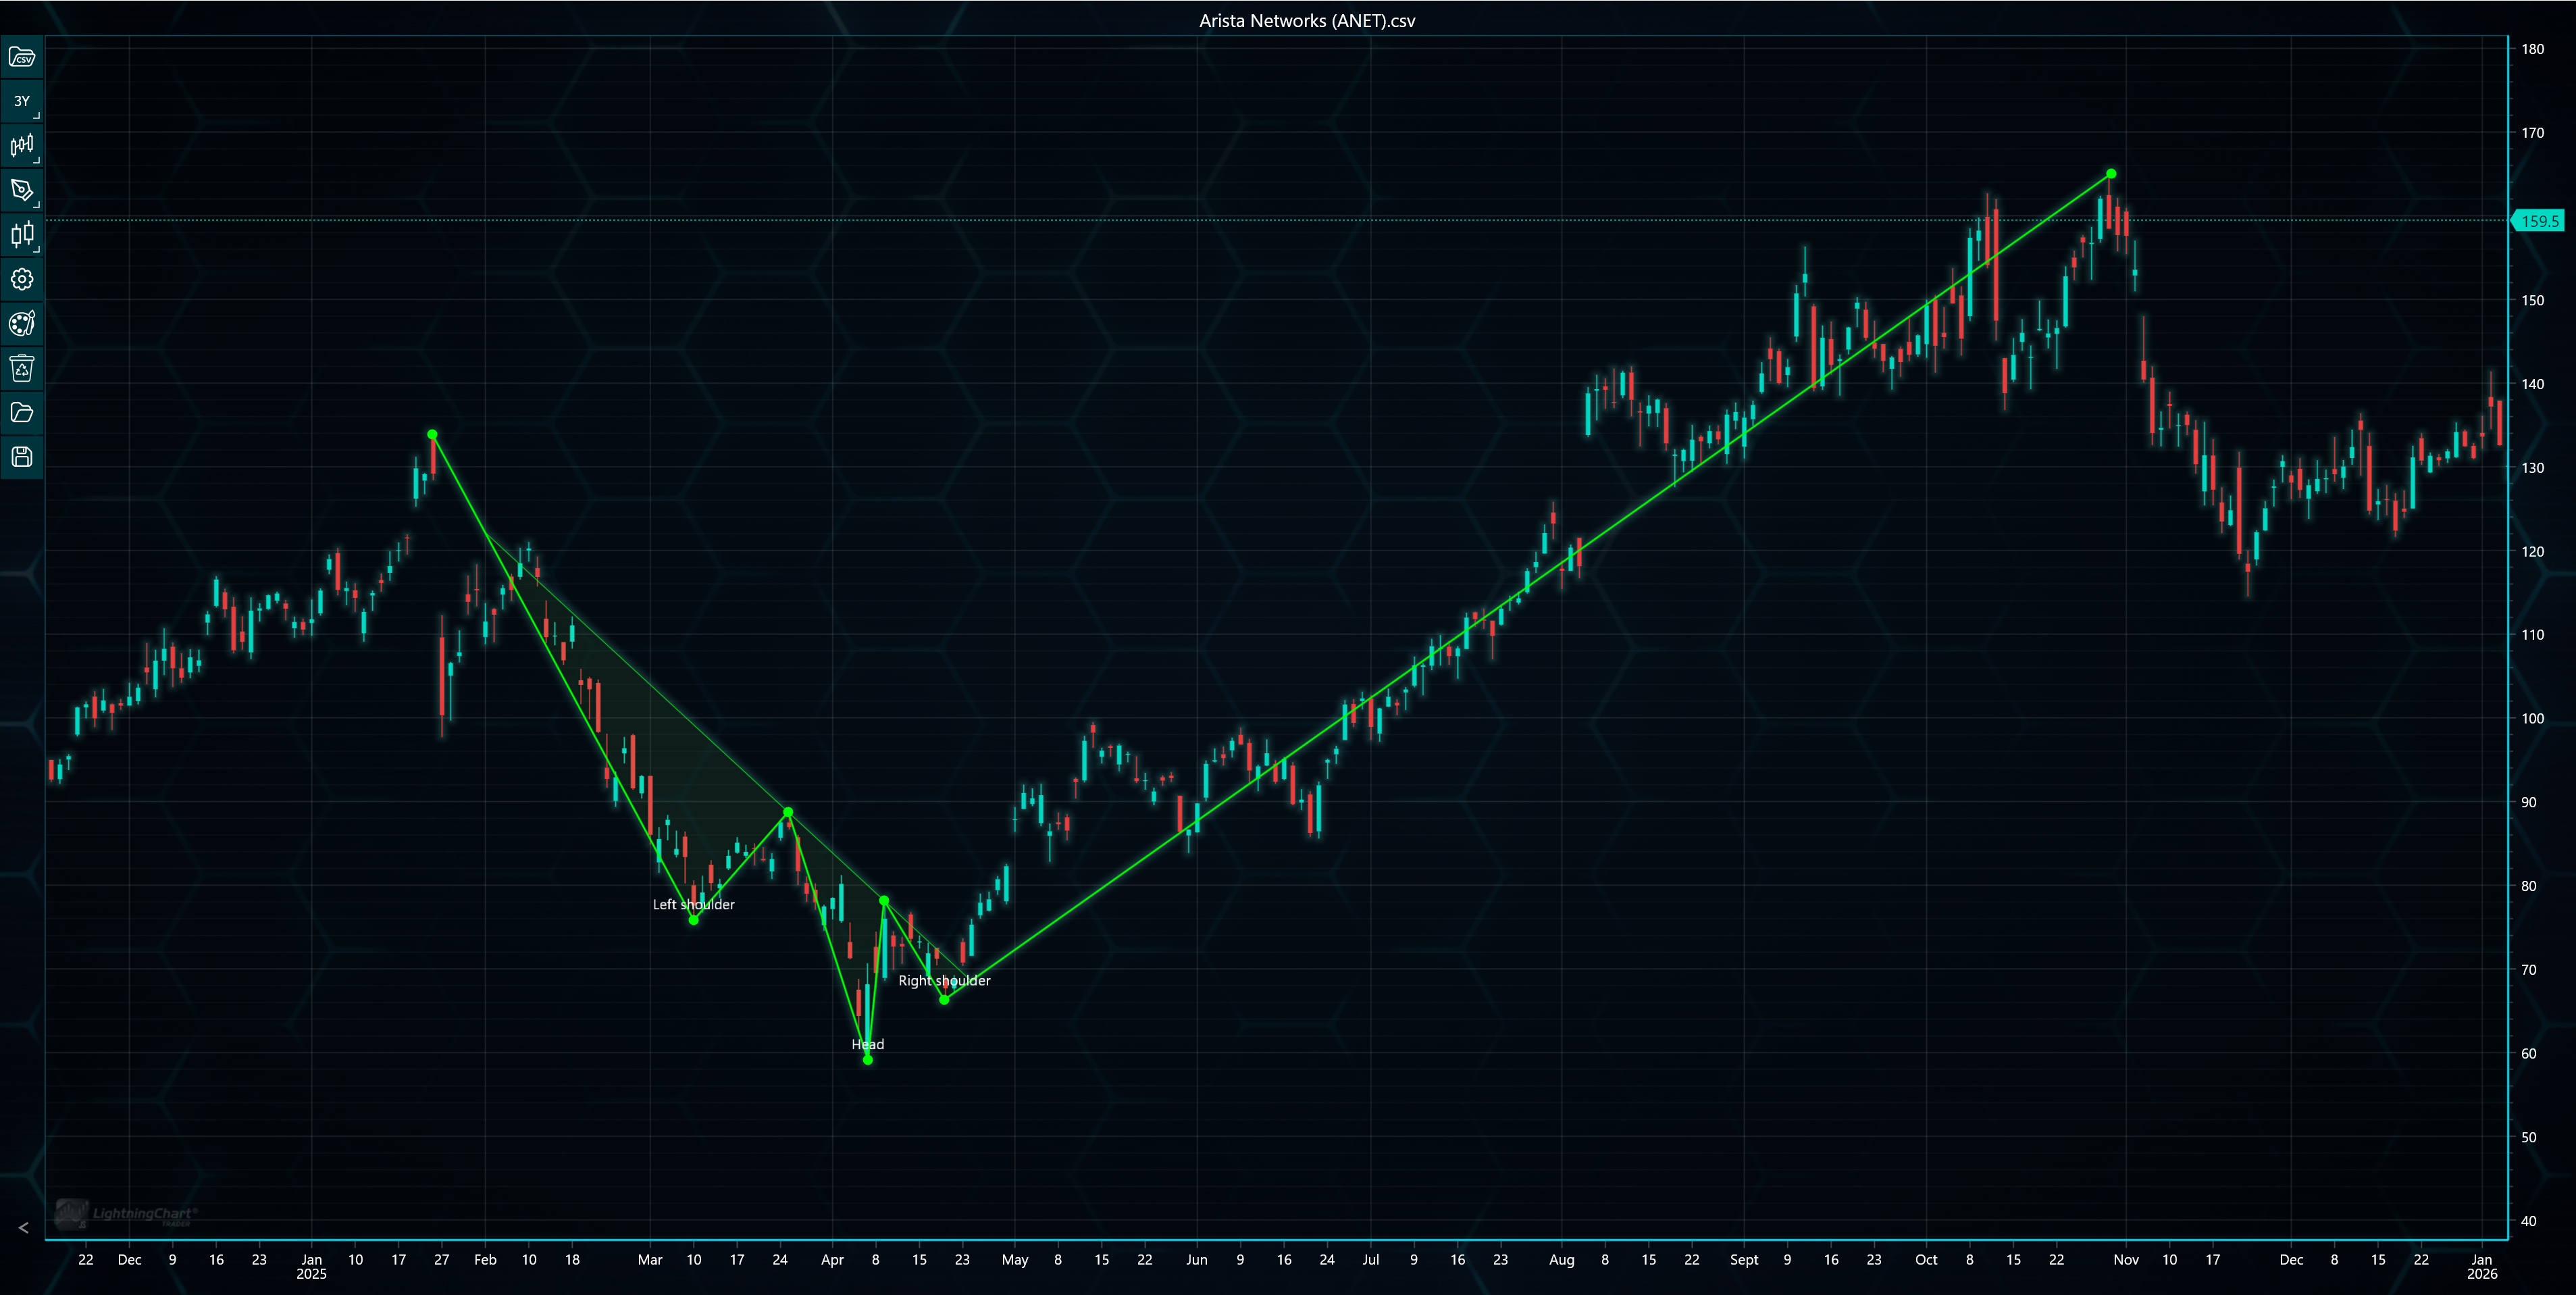
Inverse head and Shoulders pattern. A long uptrend follows when the pattern is completed.
The psychology behind the pattern is based on the battle between buyers and sellers, where each component represents certain step during the trend reversal.
Left Shoulder
The market is in a strong uptrend. Buyers push prices higher, but some traders begin taking profits, causing a pullback.
Head
Buyers regain confidence and drive prices to a new high. However, the subsequent decline is stronger than before, showing increasing selling pressure.
Right Shoulder
Buyers attempt another rally but fail to create a new high. This inability signals weakening momentum.
Neckline Break
When the price breaks below the neckline, sellers gain control, confirming the trend reversal.
As an example, imagine a stock has been climbing steadily from $80 to $120. Left Shoulder then forms at $110, and Head reaches $120. Soon after, Right Shoulder peaks at $111 while Neckline lies around $100.
In this scenario, when the price falls below $100, many traders interpret this as confirmation that the uptrend has ended and initiate short positions.
Trading with the Head and Shoulders Pattern
When it comes to trading, the Head and Shoulders pattern is quite straightforward, assuming it has been drawn correctly. Buying and selling should happen only when the neckline breaks.
Here is a step-by-step example strategy using Head and Shoulders pattern.
Step 1: Identify the whole Pattern
Wait until all three peaks are clearly visible and the neckline can be drawn. A common mistake is to force patterns where they don’t clearly exist
Step 2: Wait for Confirmation
Avoid entering before the neckline is broken. Many incomplete patterns fail to produce reversals.
A strong breakout accompanied by higher trading volume often provides stronger confirmation.
Step 3: Enter the Trade
Trade in the direction of the confirmed breakout. For a standard Head and Shoulders pattern, enter a short position after the neckline breaks. Respectively, for an Inverse Head and Shoulders enter a long position after the breakout above the neckline.
Step 4: Set a Stop-Loss
Manage risk carefully with predefined stop-loss levels. Common stop-loss placements are above the right shoulder for bearish trades and below the right shoulder for bullish inverse patterns.
Step 5: Set a Profit Target
A price target can be calculated for instance by measuring the vertical distance from the head to the neckline and projecting that same distance from the breakout point.
For example, if the head peaks at $120, and the neckline is at $110, the difference is $10. If the neckline then breaks at $110, the projected target is $100 ($110 – $10 = $100).
Advantages and limitations
As with any trading tools, Head and Shoulders pattern has its advantages and limitations, and is not 100% reliable. It is therefore recommended to use it together with other technical indicators such as moving averages, RSI, and MACD, as well as volume analysis; look for increased volume during the breakout.
Advantages
- The Head and Shoulders pattern has a distinct shape that is relatively easy to identify after some practice.
- The pattern can be applied to stocks, Forex, cryptocurrencies, commodities, and indices.
- It naturally provides logical locations for stop-loss orders and profit targets.
- The pattern is applicable to multiple timeframes, appearing on 5-minute, hourly, daily, and weekly charts. Generally, patterns on higher timeframes tend to be more reliable.
Limitations
- Not every neckline break results in a sustained reversal or reach its projected target. Prices sometimes recover quickly after breaking the neckline.
- Traders may draw the neckline differently or disagree on whether the shoulders are symmetrical enough to qualify as a valid pattern.
- In traditional technical analysis, decreasing volume during the formation and increasing volume on the neckline break strengthen the signal. Markets with limited or unreliable volume data (such as spot forex) may require traders to rely more on price action and other confirmation tools.
Head and Shoulders in LightningChart JS Trader
Most trading data visualization platforms have Head and Shoulders pattern built in. In this chapter, we’ll look at one of them, LightningChart JS Trader.
LightningChart JS Trader is a high-performance financial charting solution built on the LightningChart JS platform, designed for professional trading and market analysis applications. It provides advanced interactive charts, real-time data visualization, technical indicators, drawing tools, and seamless handling of large streaming datasets. With its GPU-accelerated rendering engine, LightningChart JS Trader delivers smooth performance even with large datasets, enabling developers to build responsive, feature-rich trading platforms for web-based financial applications.
In LightningChart JS Trader, the Head and Shoulders pattern can be drawn by selecting it from the drawing tool menu and patterns sub-menu found in the left toolbar. After this, all the points can be positioned one-by-one by simply clicking the chart.
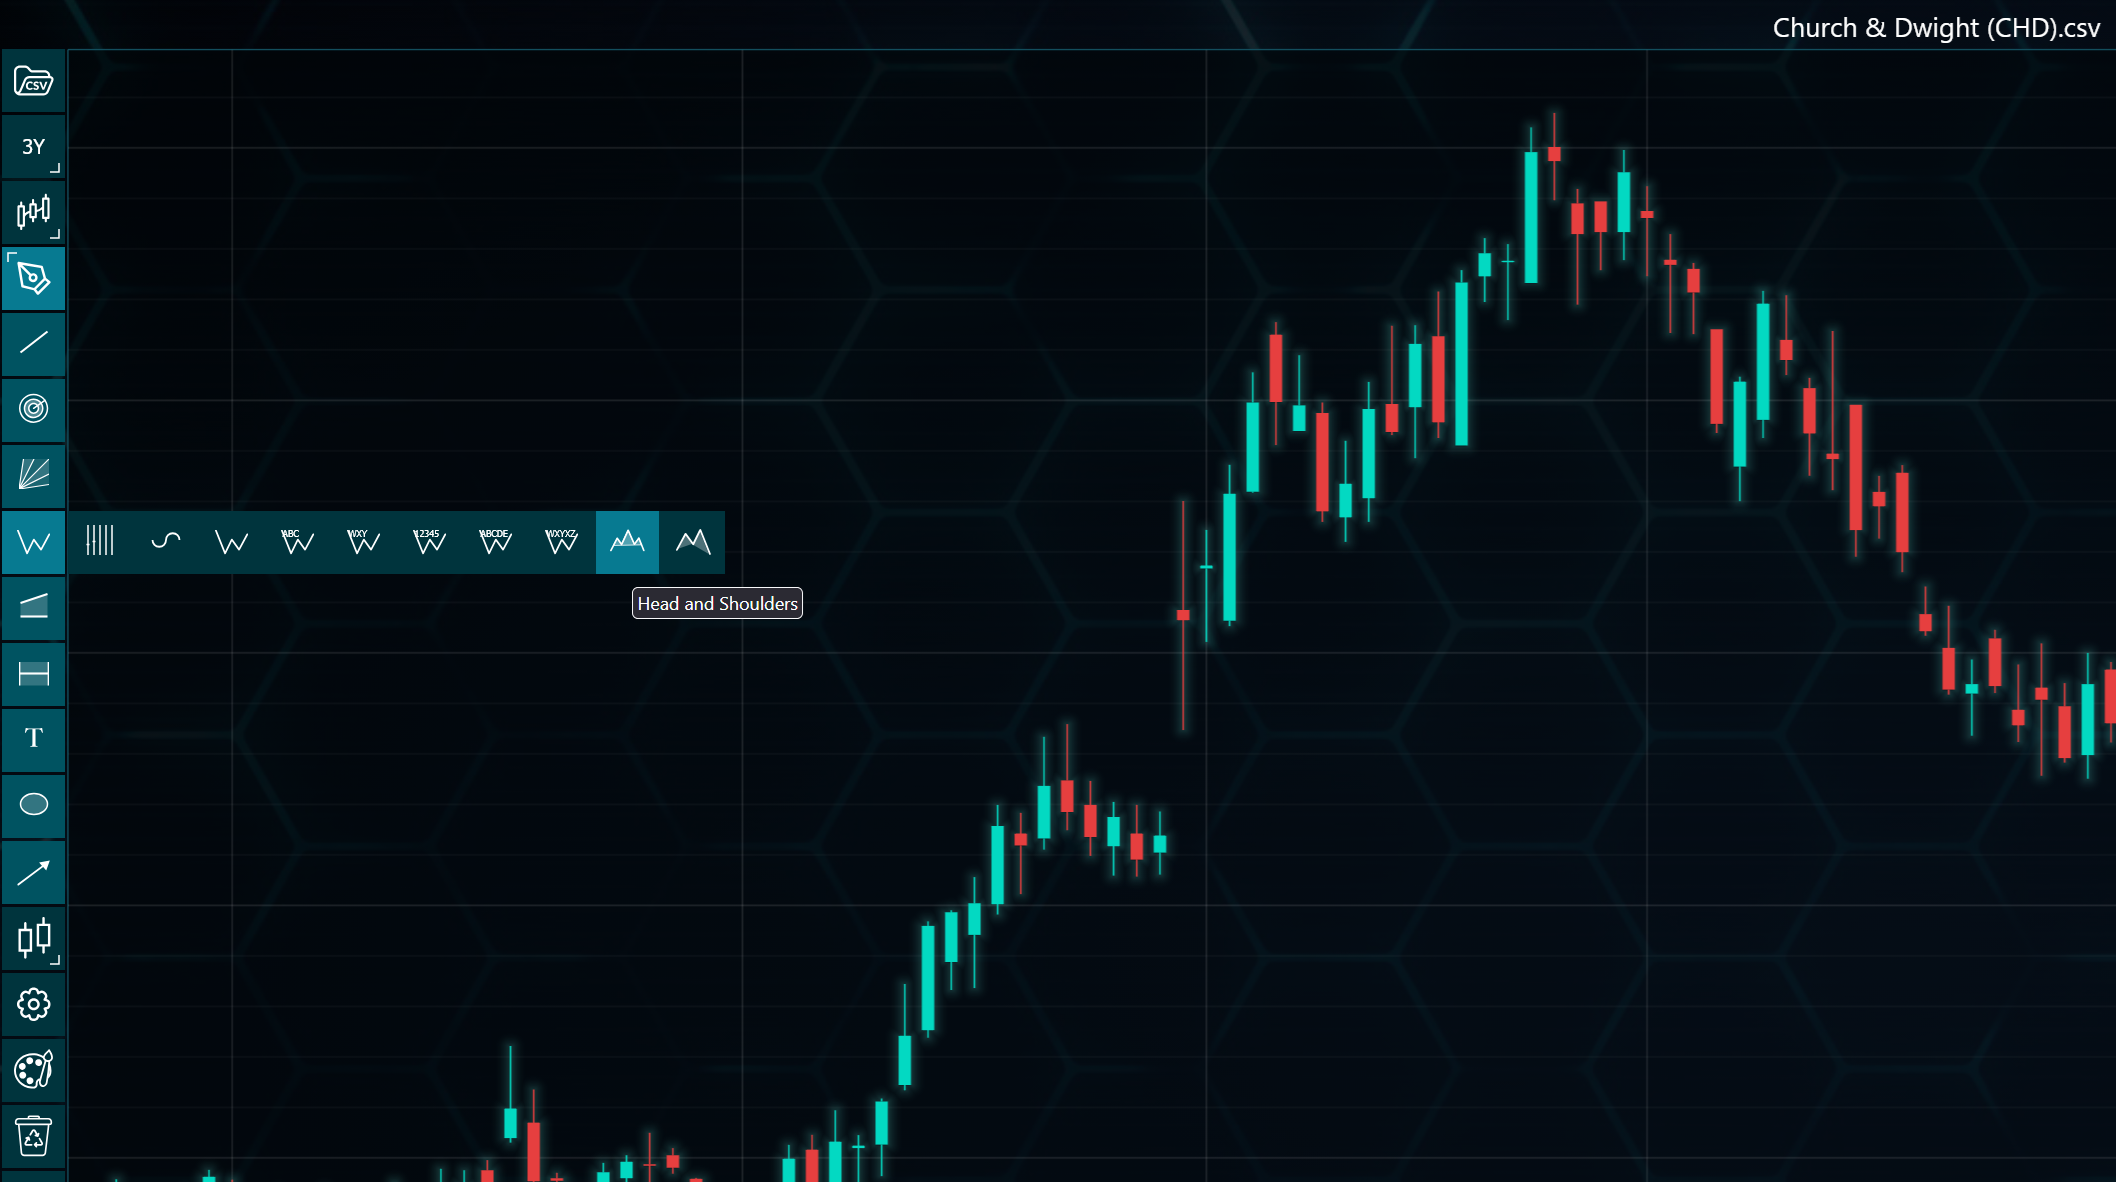
Selecting Head and Shoulders in LightningChart JS Trader. Clicking the corresponding icon will initiate the drawing.
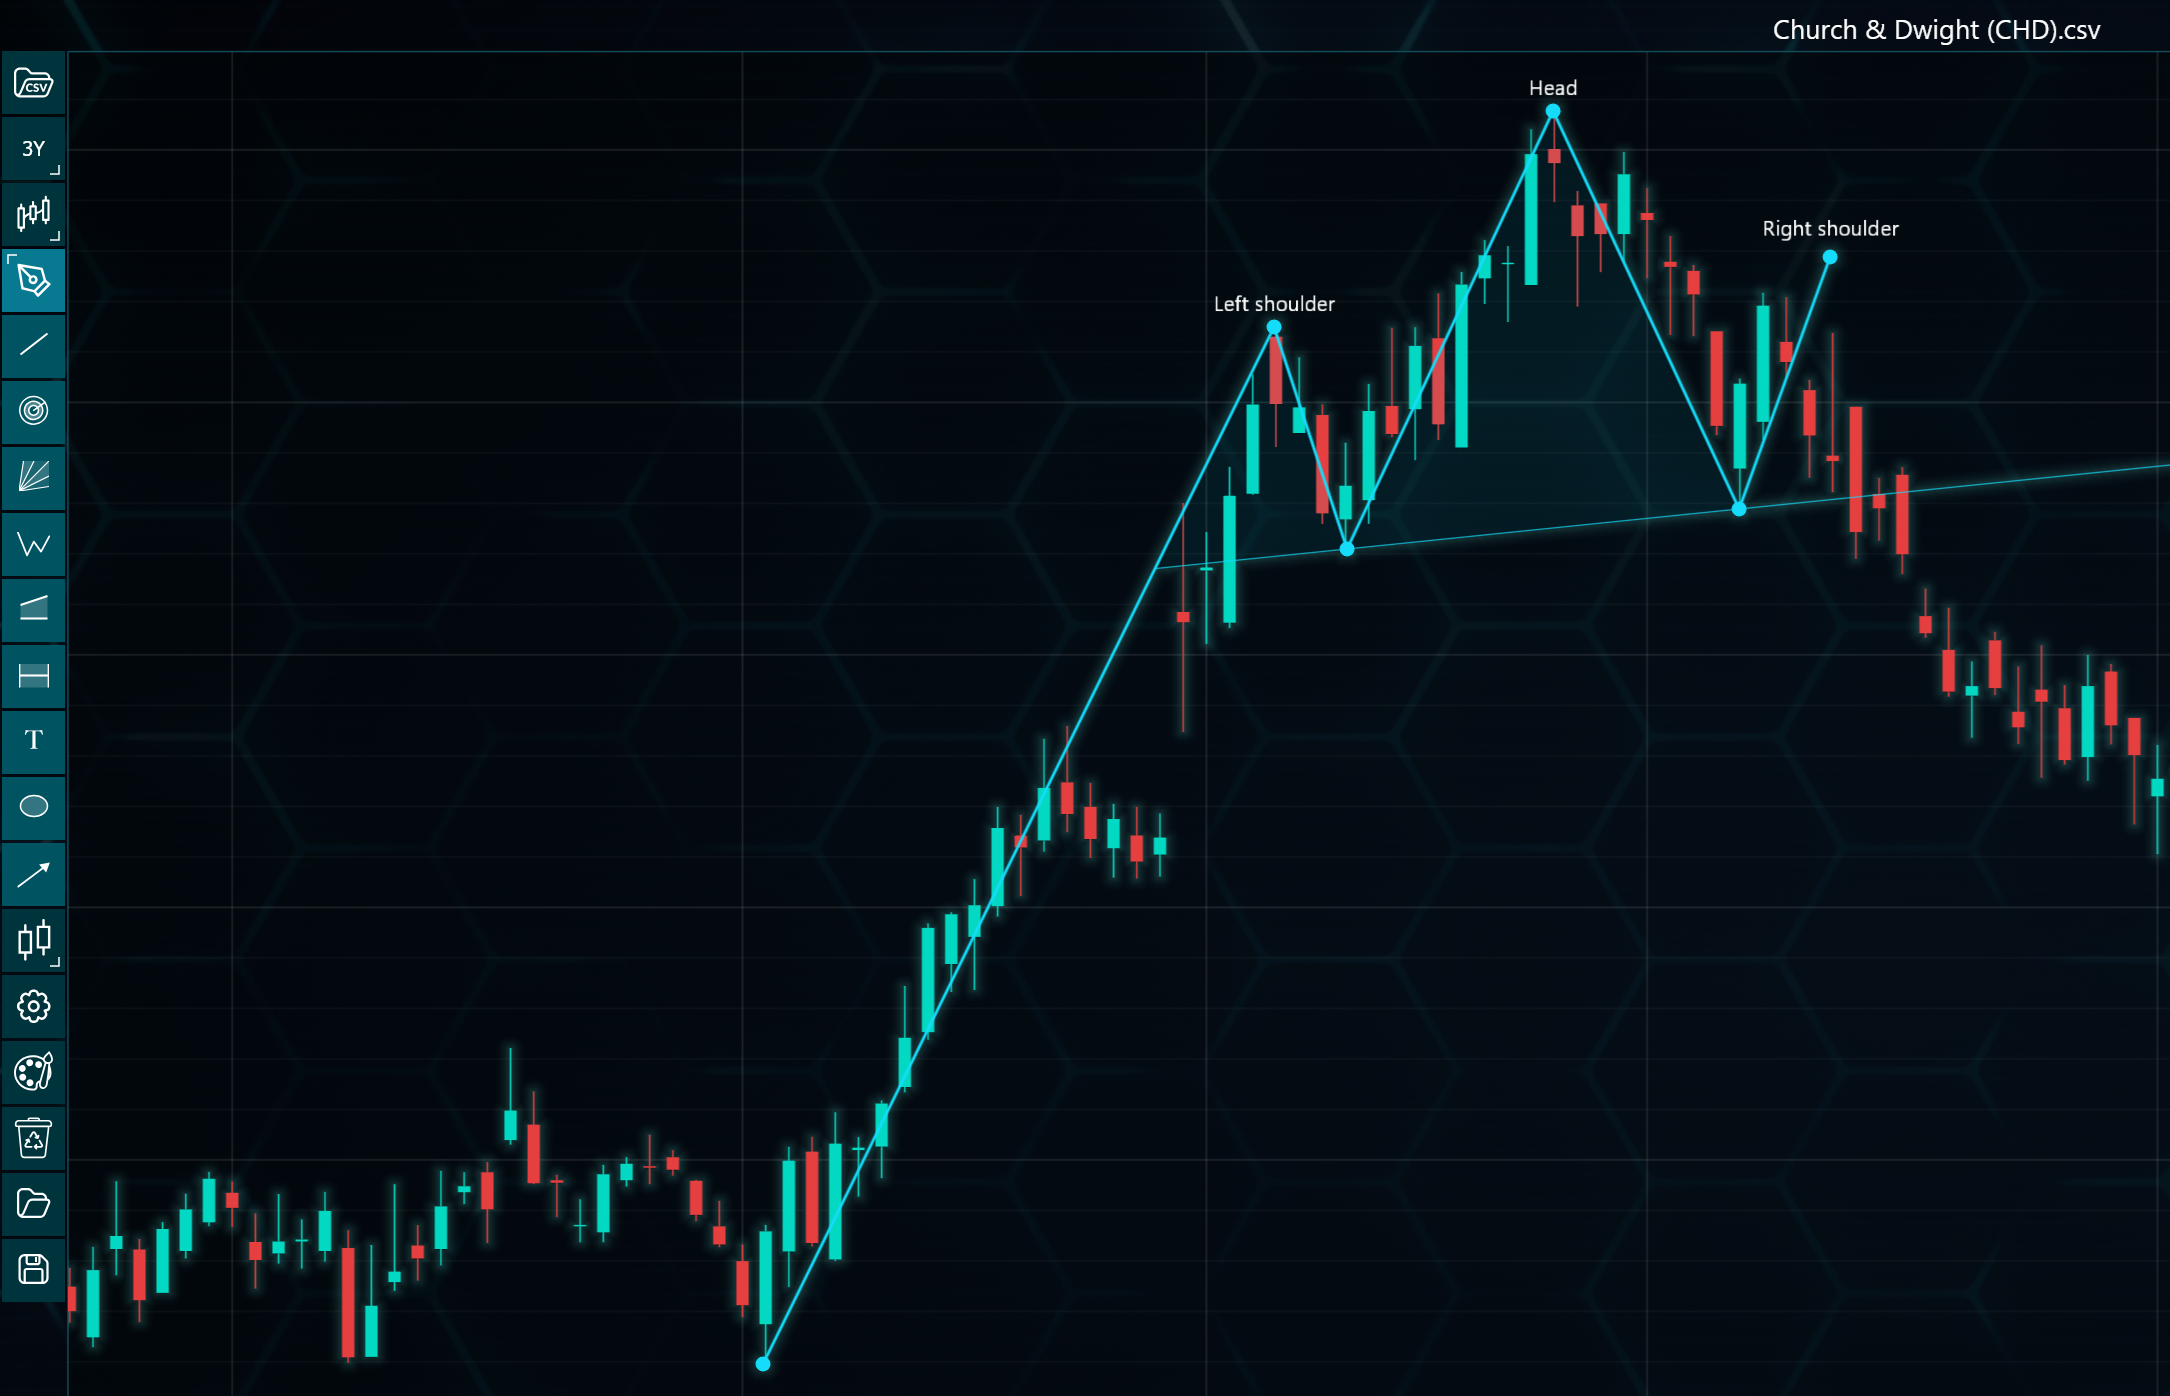
Drawing Head and Shoulders pattern. Currently locating the right shoulder, after which the end point will be positioned on the chart.
LightningChart JS Trader also has an option to place drawing tools in code instead of via user interface. In case of Head and Shoulders, this can be done with addHeadAndShoulders() method:
tradingChart.drawingTools().addHeadAndShoulders(startX, startY…)
The method requires position values for each of the seven points used to form the pattern.
After a Head and Shoulders patters has been drawn, LightningChart JS Trader allows configuring its appearance via the setting menu, brought up by right-clicking (double tap in mobile) one of the points.
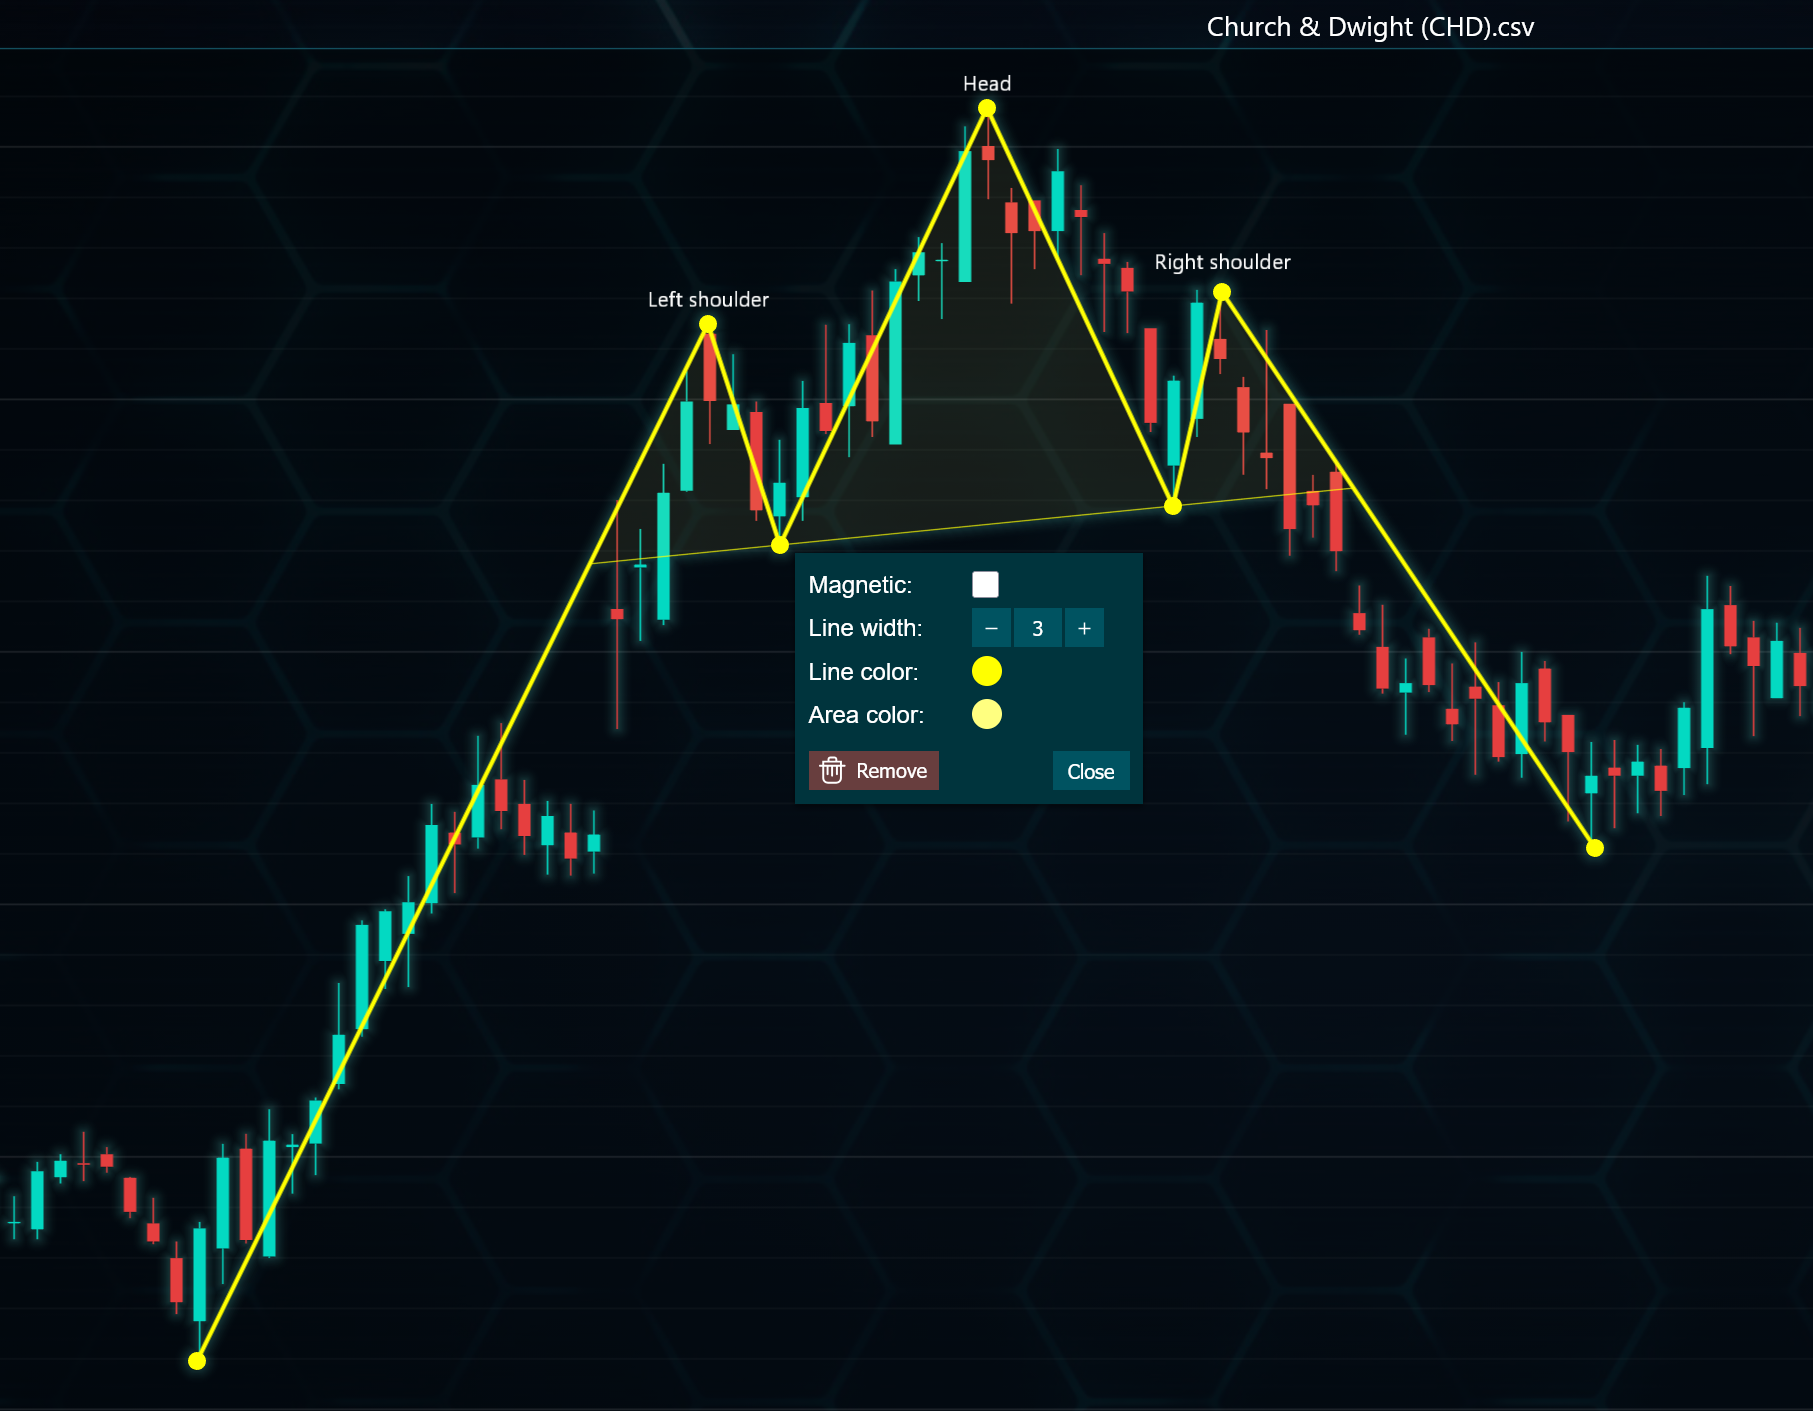
Configuring the Head and Shoulders pattern.
Conclusion
The Head and Shoulders pattern remains one of the most respected reversal patterns in technical analysis because it reflects a shift in market psychology, from buyer dominance to seller control, or vice versa in the inverse version. While no chart pattern guarantees success, combining the Head and Shoulders pattern with sound risk management, confirmation from other technical indicators, and awareness of the broader market context can make it a valuable part of a trader’s toolkit.
Like all technical analysis techniques, it should be viewed as one piece of a broader trading strategy rather than a standalone signal. With practice and disciplined execution, traders can use this classic pattern to identify potential reversals and make more informed trading decisions.
Built better Fintech apps with LightningChart JS Trader v4.0
To learn more about this release, visit the documentation.
See more news
LightningChart .NET v.12.6.1
LightningChart .NET v.12.6.1 is out now!Features of LightningChart® .NET version 12.6.1In this release we added new features, made several improvements and fixed dozens of errors. We upgraded target framework (from .NET 8.0 to 10.0), added Universal-Data-Parser...
Trend Lines in Trading
Trend lines are among the simplest yet most powerful tools in technical analysis. They help traders visualize market direction, identify potential support and resistance levels, and make more informed trading decisions. Despite their simplicity, trend lines remain a...
Announcement: Baumer as LightningChart customer
Enabling High-Performance Visualization of Industrial Sensor Data with LightningChartDiscover how Baumer uses LightningChart to configure and visualize data from a wide variety of industrial sensors and create responsive, data-rich visualization...
Best Python Charting Library in 2026
Python's charting ecosystem is large, overlapping, and regularly misunderstood. Most comparison guides stop at Matplotlib, Plotly, and Seaborn. This one goes further: it covers what happens when your datasets grow large, your update rates increase, or your chart types...



If you have any questions, feel free to contact us!



©LightningChart Ltd 2026. All rights reserved.





