


LightningChart® Trader for .NET – Coming in April 2020.
Next major release of LightningChart® .NET will be equipped with brand new charting components, greatly simplifying the development process of trading applications. LightningChart Trader UI control will be included in all LightningChart .NET subscription packages without any additional cost (including Trader API source code). Full LightningChart .NET API is available under the hood for implementing custom functionality with the lightning-fast GPU-accelerated rendering. Launch version includes WPF charts, Windows Forms and UWP trading charts will become available later 2020.
When LightningChart Trader UI control is added into WPF application, user can select a security and a date range, and then get the corresponding trading data set of most recent data loaded from a web service. Alternatively, developers can implement a custom data provider class, or just get the data from anywhere programmatically and give it to the chart as an array or CSV-file.
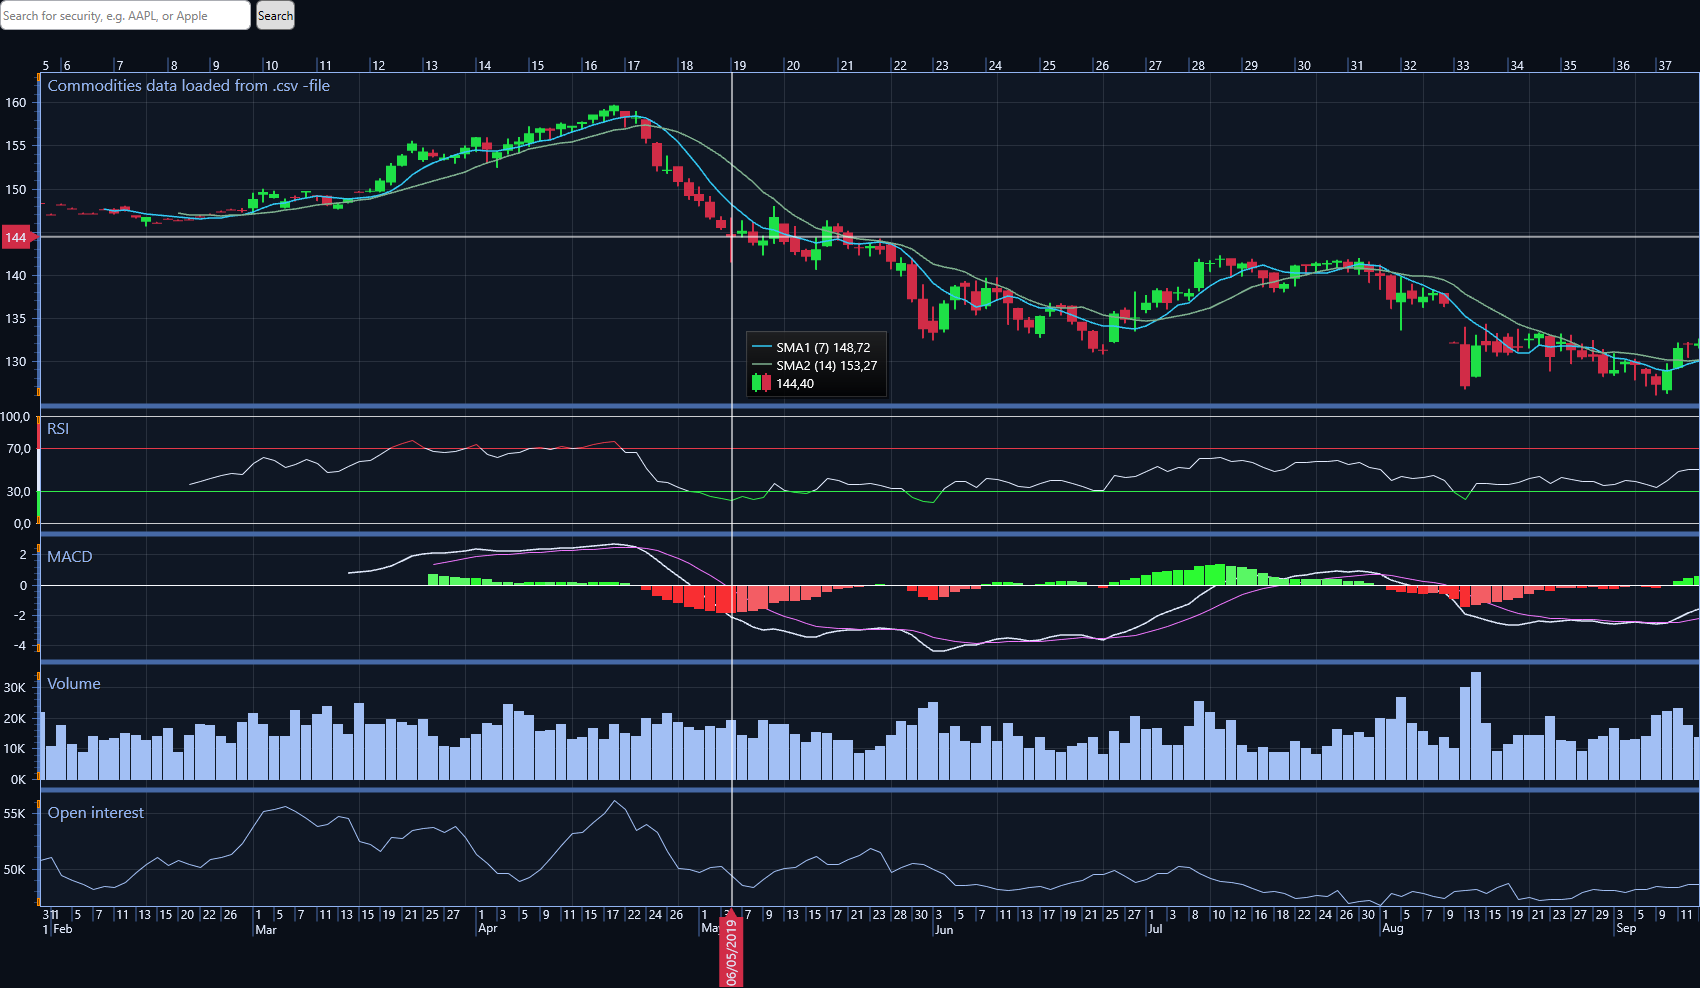
Trader chart has several built-in functionalities such as data cursors for tracking individual data values, automatic removal of non-trading time periods, and technical indicators which are calculated from the opened data set based with given parameters.

Available indicators include for example:
- Simple Moving Average (SMA)
- Weighted Moving Average (WMA)
- Exponential Moving Average (EMA)
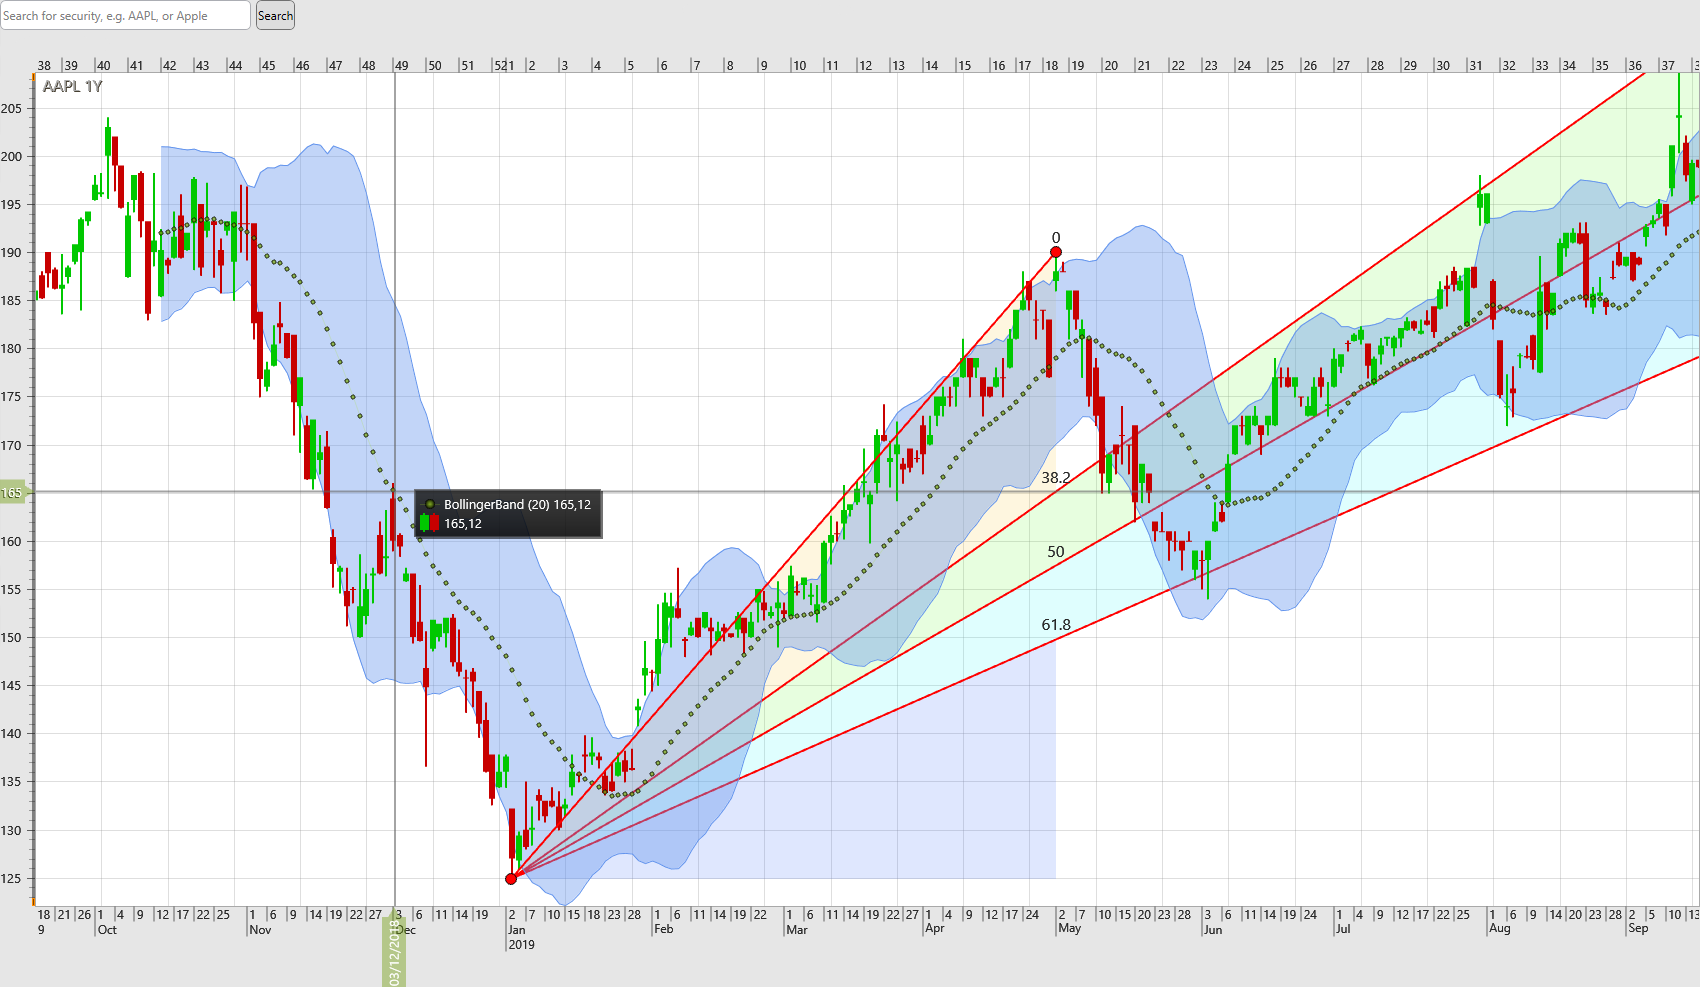
- Bollinger bands
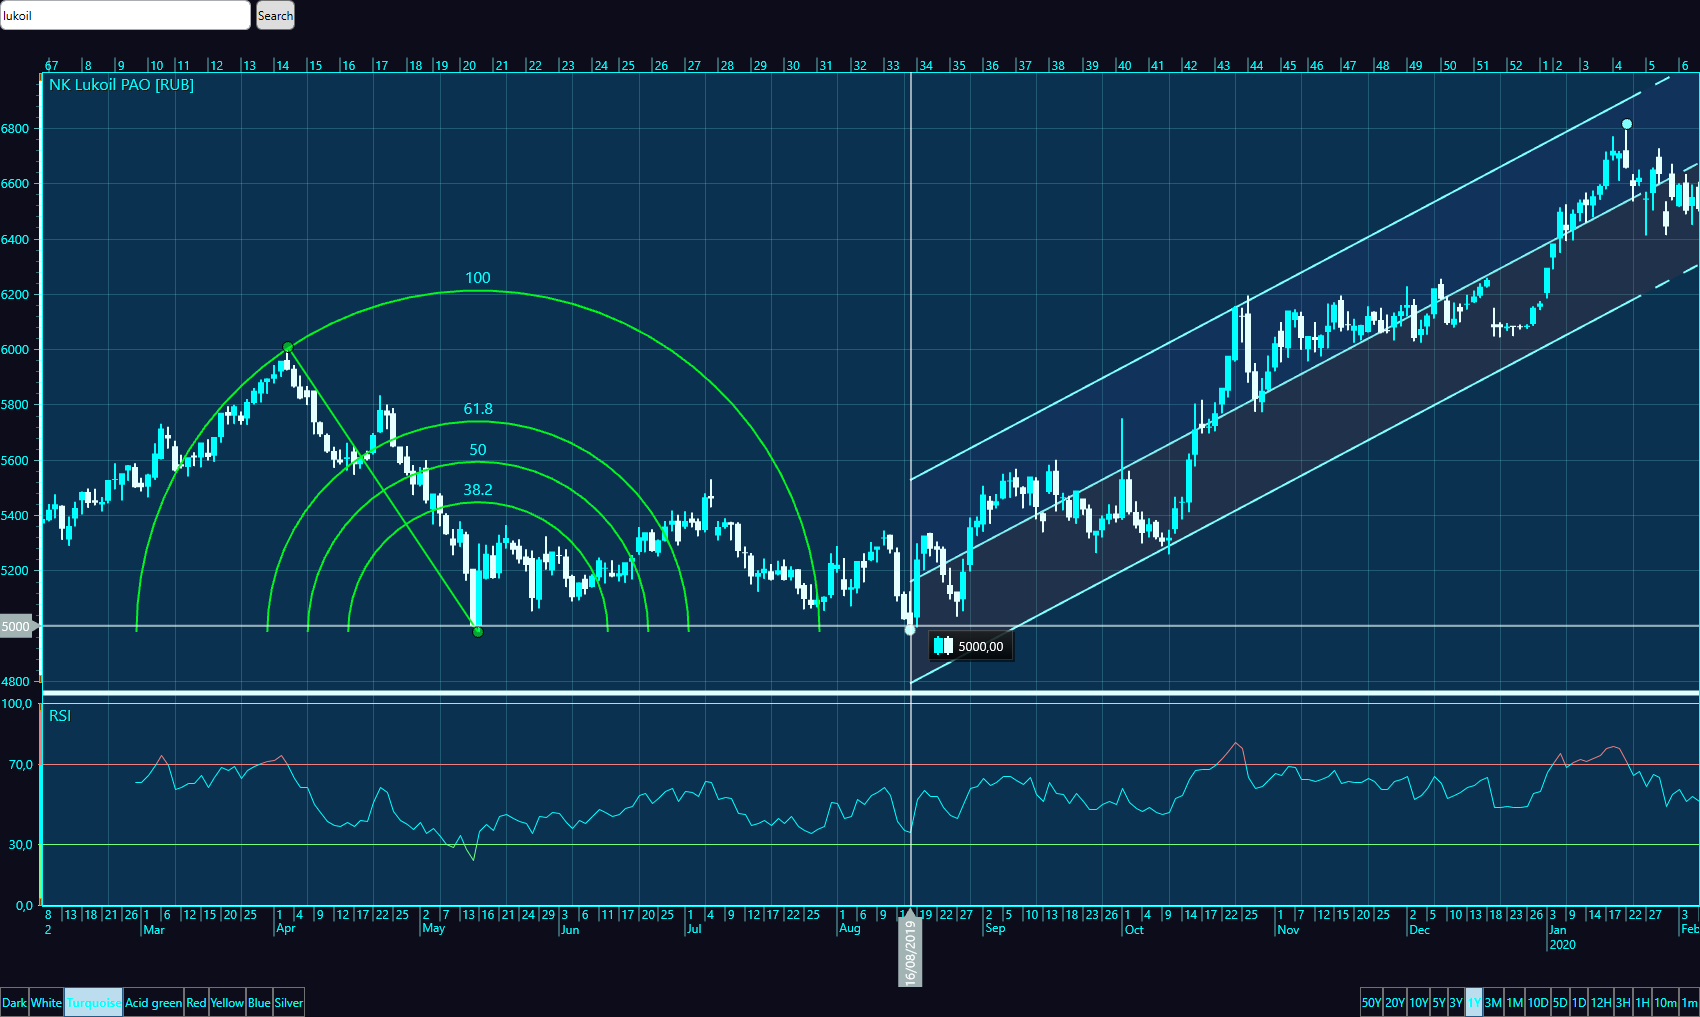
- Relative Strength Index (RSI)
- Moving Average Convergence Divergence (MACD)
- Volume
- Open Interest (OI)
Various drawing tools for data analytics are also provided. These can be drawn at any point of the chart. Available drawing tools include for instance:
- Fibonacci retracement
- Fibonacci fans
- Fibonacci arcs
- Trend line
- Trend line with extensions
- Linear regression line
- Linear regression channels based on standard deviation, as well as Raff channel
Start creating your trading application by downloading LightningChart® .NET from LightningChart Portal.
If you have any questions, feel free to contact us!