News
Alpha Omega Engineering
Date of case study: 04/2024Industry of business: Clinical NeuroscienceEstablished: 1993LightningChart solution: XY ChartsAlpha Omega EngineeringAlpha Omega is the market leader in physiological navigation for advanced neurosurgical procedures, like deep brain...
LightningChart Python Beta has been released!
LightningChart Python has been released!A dedicated data visualization library for Python programming language.Introducing LightningChart PythonWe are excited to announce the release of a dedicated data visualization library for Python that will deliver the signature...
LightningChart .NET v.11.0.1
LightningChart .NET v.11.0.1 has been released!A new .NET target framework, Interactive Examples, DPI awareness, and more.New .NET target frameworkIn the previous versions of LightningChart .NET, the .NET target framework was 4.6.2 or earlier. But, in this new version...
LightningChart JS v.5.1
LightningChart JS v.5.1 has been released!The v.5.1 release includes new chart examples, new features, visual improvements, and React updates.Mesh Model 3DWe’re introducing the new Mesh Model 3D chart type for rendering complex 3D geometries at high performance. The...
JU Solar Team
Date of case study: 01/2024Industry of business: AutomotiveEstablished: 2013LightningChart solution: XY ChartsJU Solar TeamJU Solar Team is a student-driven project started in 2013 where students come together to build a solar-powered car with the goal to compete in...
.NET 8 Compatibility
LightningChart .NET compatible with .NET 8.0 - video updateAn update on LightningChart .NET's compatibility with the latest version of .NETLightningChart .NET is compatible with .NET 8With the release of .NET 8.0 in November 2023, we wanted to announce LightningChart...
Merry Christmas & Happy New Year!
Happy Holidays from It’s a been a very busy year for LightningChart, and we’d like to thank all the customers and partners for the year 2023. We have created world’s first low-level GPU accelerated charting library, for .NET, WinForms, WPF and UWP, and enabled new...
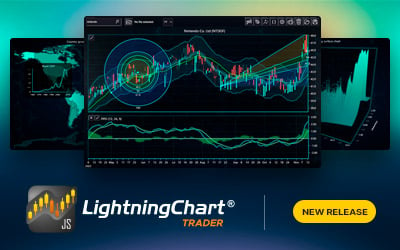
LightningChart JS Trader
LightningChart JS Trader is out now!LightningChart JS Trader is a comprehensive charting package to build industry-leading applications for finance and trading.LightningChart JS TraderWe're delighted to announce the new LightningChart JS Trader charting package for...
LightningChart JS v.5.0
LightningChart JS v.5.0 has been released!5.0 is a major release and comes with new product features, visual, and developer experience improvements!WebGL Context SharingConsider that LightningChart JS v.5.0 is a backward-incompatible release and we strongly advise you...
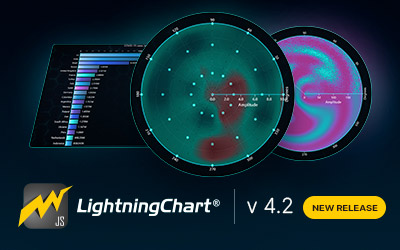
LightningChart JS v.4.2
LightningChart JS v.4.2 has been released!Introducing new Developers' Documentation, Polar heatmaps, improvements for Bar charts, and more!Polar HeatmapsPolar charts feature new series types which allow visualizing heatmaps within a polar coordinate system. This type...

