Releasing LightningChart Python Trader 1.1Introducing new product features and UX improvements.Releasing new product...


Regional Account & Marketing Executive (China, Japan and South Korea)
+358 503 543 706
Book a meeting
Regional Account Manager (North America, South America)
+358 505 528 995
Book a meetingOur dedicated sales team is ready to help you find the perfect solution for your data visualization needs. Don't hesitate to reach out for personalized assistance or to schedule a demo of our products.

Regional Account & Marketing Executive (China, Japan and South Korea)
+358 503 543 706
Book a meetingRegional Account Manager (North America, South America)
+358 505 528 995
Book a meetingOur dedicated sales team is ready to help you find the perfect solution for your data visualization needs. Don't hesitate to reach out for personalized assistance or to schedule a demo of our products.

Releasing LightningChart Python Trader 1.1Introducing new product features and UX improvements.Releasing new product...
Announcing LightningChart JS Trader v.4.0A release focused on user experience, flexibility, and real-time data...
Announcing LightningChart JS v.8.1New product features, performance, and developer experience improvements.New Product...
LightningChart Python has been released!A dedicated data visualization library for Python programming...
LightningChart .NET v.11.0.1 has been released!A new .NET target framework, Interactive Examples, DPI awareness, and...
LightningChart JS v.5.1 has been released!The v.5.1 release includes new chart examples, new features, visual...
Date of case study: 06/2025 First collaboration: 01/2024 Industry of business: Automotive Established: 2013...
LightningChart .NET compatible with .NET 8.0 - video updateAn update on LightningChart .NET's compatibility with the...
Happy Holidays from It’s a been a very busy year for LightningChart, and we’d like to thank all the customers and...
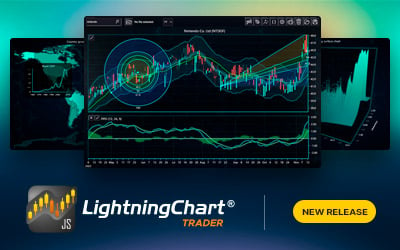
LightningChart JS Trader is out now!LightningChart JS Trader is a comprehensive charting package to build...
LightningChart JS v.5.0 has been released!5.0 is a major release and comes with new product features, visual, and...
LightningChart JS v.4.2 has been released!Introducing new Developers' Documentation, Polar heatmaps, improvements for...