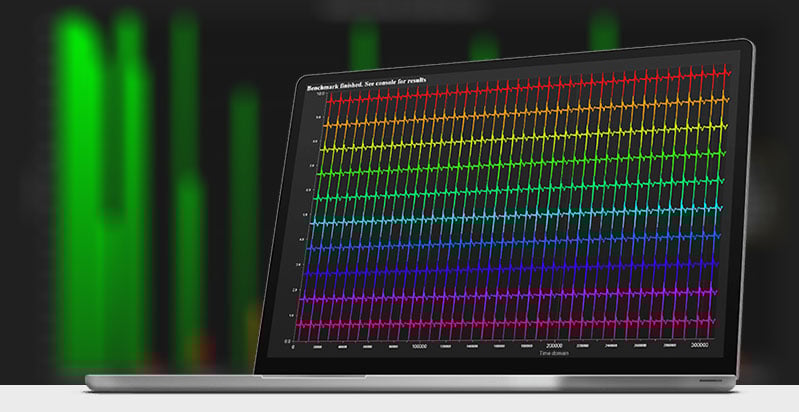
LightningChart® JS – The Fastest JavaScript Charts. Period.
LightningChart® has, since the beginning of its journey over 10 years ago, been about exceptionally at high-performance level. And now after the release of version 3.0.0, we can with confidence say that LightningChart JS has also risen to the level where LightningChart controls are used to perform – well above any other JavaScript chart.
In recent Line charts performance comparison test, none of the competitors got even close to LightningChart performance level. LightningChart’s initial rendering time is smallest or amongst the smallest, it runs with very compact memory footprint, with lowest CPU overhead, and fastest response to mouse interactions, reaching higher usable data point rates than any other chart.
We have gathered on one page all the information relevant to performance of LightningChart JS. From there you will find access to performance comparison, performance demo, and performance test results.

LightningChart’s strength definitely is the exceptional rendering performance, allowing to build very advanced and data-intensive applications. We are very proud of what we have done, broken all the previous performance limits in JavaScript charting.
See more news
SQL and LightningChart JS dashboard
Published on April 18th, 2024 | Written by humanSQL Dashboard ApplicationHello! In today's article, we will see work on a small project using several development tools. We will create an SQL Dashboard with data generated in SQL Server and use Angular for web...
Alpha Omega Engineering
Date of case study: 04/2024Industry of business: Clinical NeuroscienceEstablished: 1993LightningChart solution: XY ChartsAlpha Omega EngineeringAlpha Omega is the market leader in physiological navigation for advanced neurosurgical procedures, like deep brain...
JavaScript 2D Bubble Chart
JavaScript 2D Bubble ChartIn this article, we will create a JavaScript 2D bubble chart using Node JS and LightningChart JS. Remember that you can download the template and use it to experiment with it. When we are looking for an attractive way to represent our data,...
Create a JavaScript Stacked Bar Chart
JavaScript Stacked Bar ChartStacked bar charts are very useful in scenarios where we see large groups of data from different categories, or values from each other. We can see how a category is divided into segments, from the largest to the smallest in relation to...
