LightningChart JS v.4.0.0 has been released!
Beautiful charts, introducing the DataGrid component, new color Themes, and more.
Beautiful Charts
We know that data visualization goes beyond simply understanding data. As of today, DV has become a field with the freedom of expressing beautiful formatted visualizations and dashboards for displaying data that engages.
This is our new approach: communicate data using our Next Generation Color Themes and help our users display Beautiful Charts in their applications.

The new color themes included in this v.4.0.0 release are:
- darkGold
- cyberSpace
- turquoiseHexagon
- light
- lightNature
Would you like to create your own Next-Gen color themes?
We invite our users to recreate their own next-generation Color Themes. You’ll find all the necessary tools for recreating your own themes along with the 4.0.0 version of LightningChart JS.
Introducing the DataGrid Component
The DataGrid component is a novel feature introduced as a stand-alone component that can allocate numbers and text grids.
Additionally, the DataGrid component has built-in formatted coloring and spark charts for displaying historical trends in small spaces.
DataGrid Component
Notice that even though the DataGrid component becomes available in this 4.0.0 release, it is sold separately as an expansion pack for LightningChart JS users.
For more information and pricing, see the DataGrid Product Page.
Sweeping Line Charts
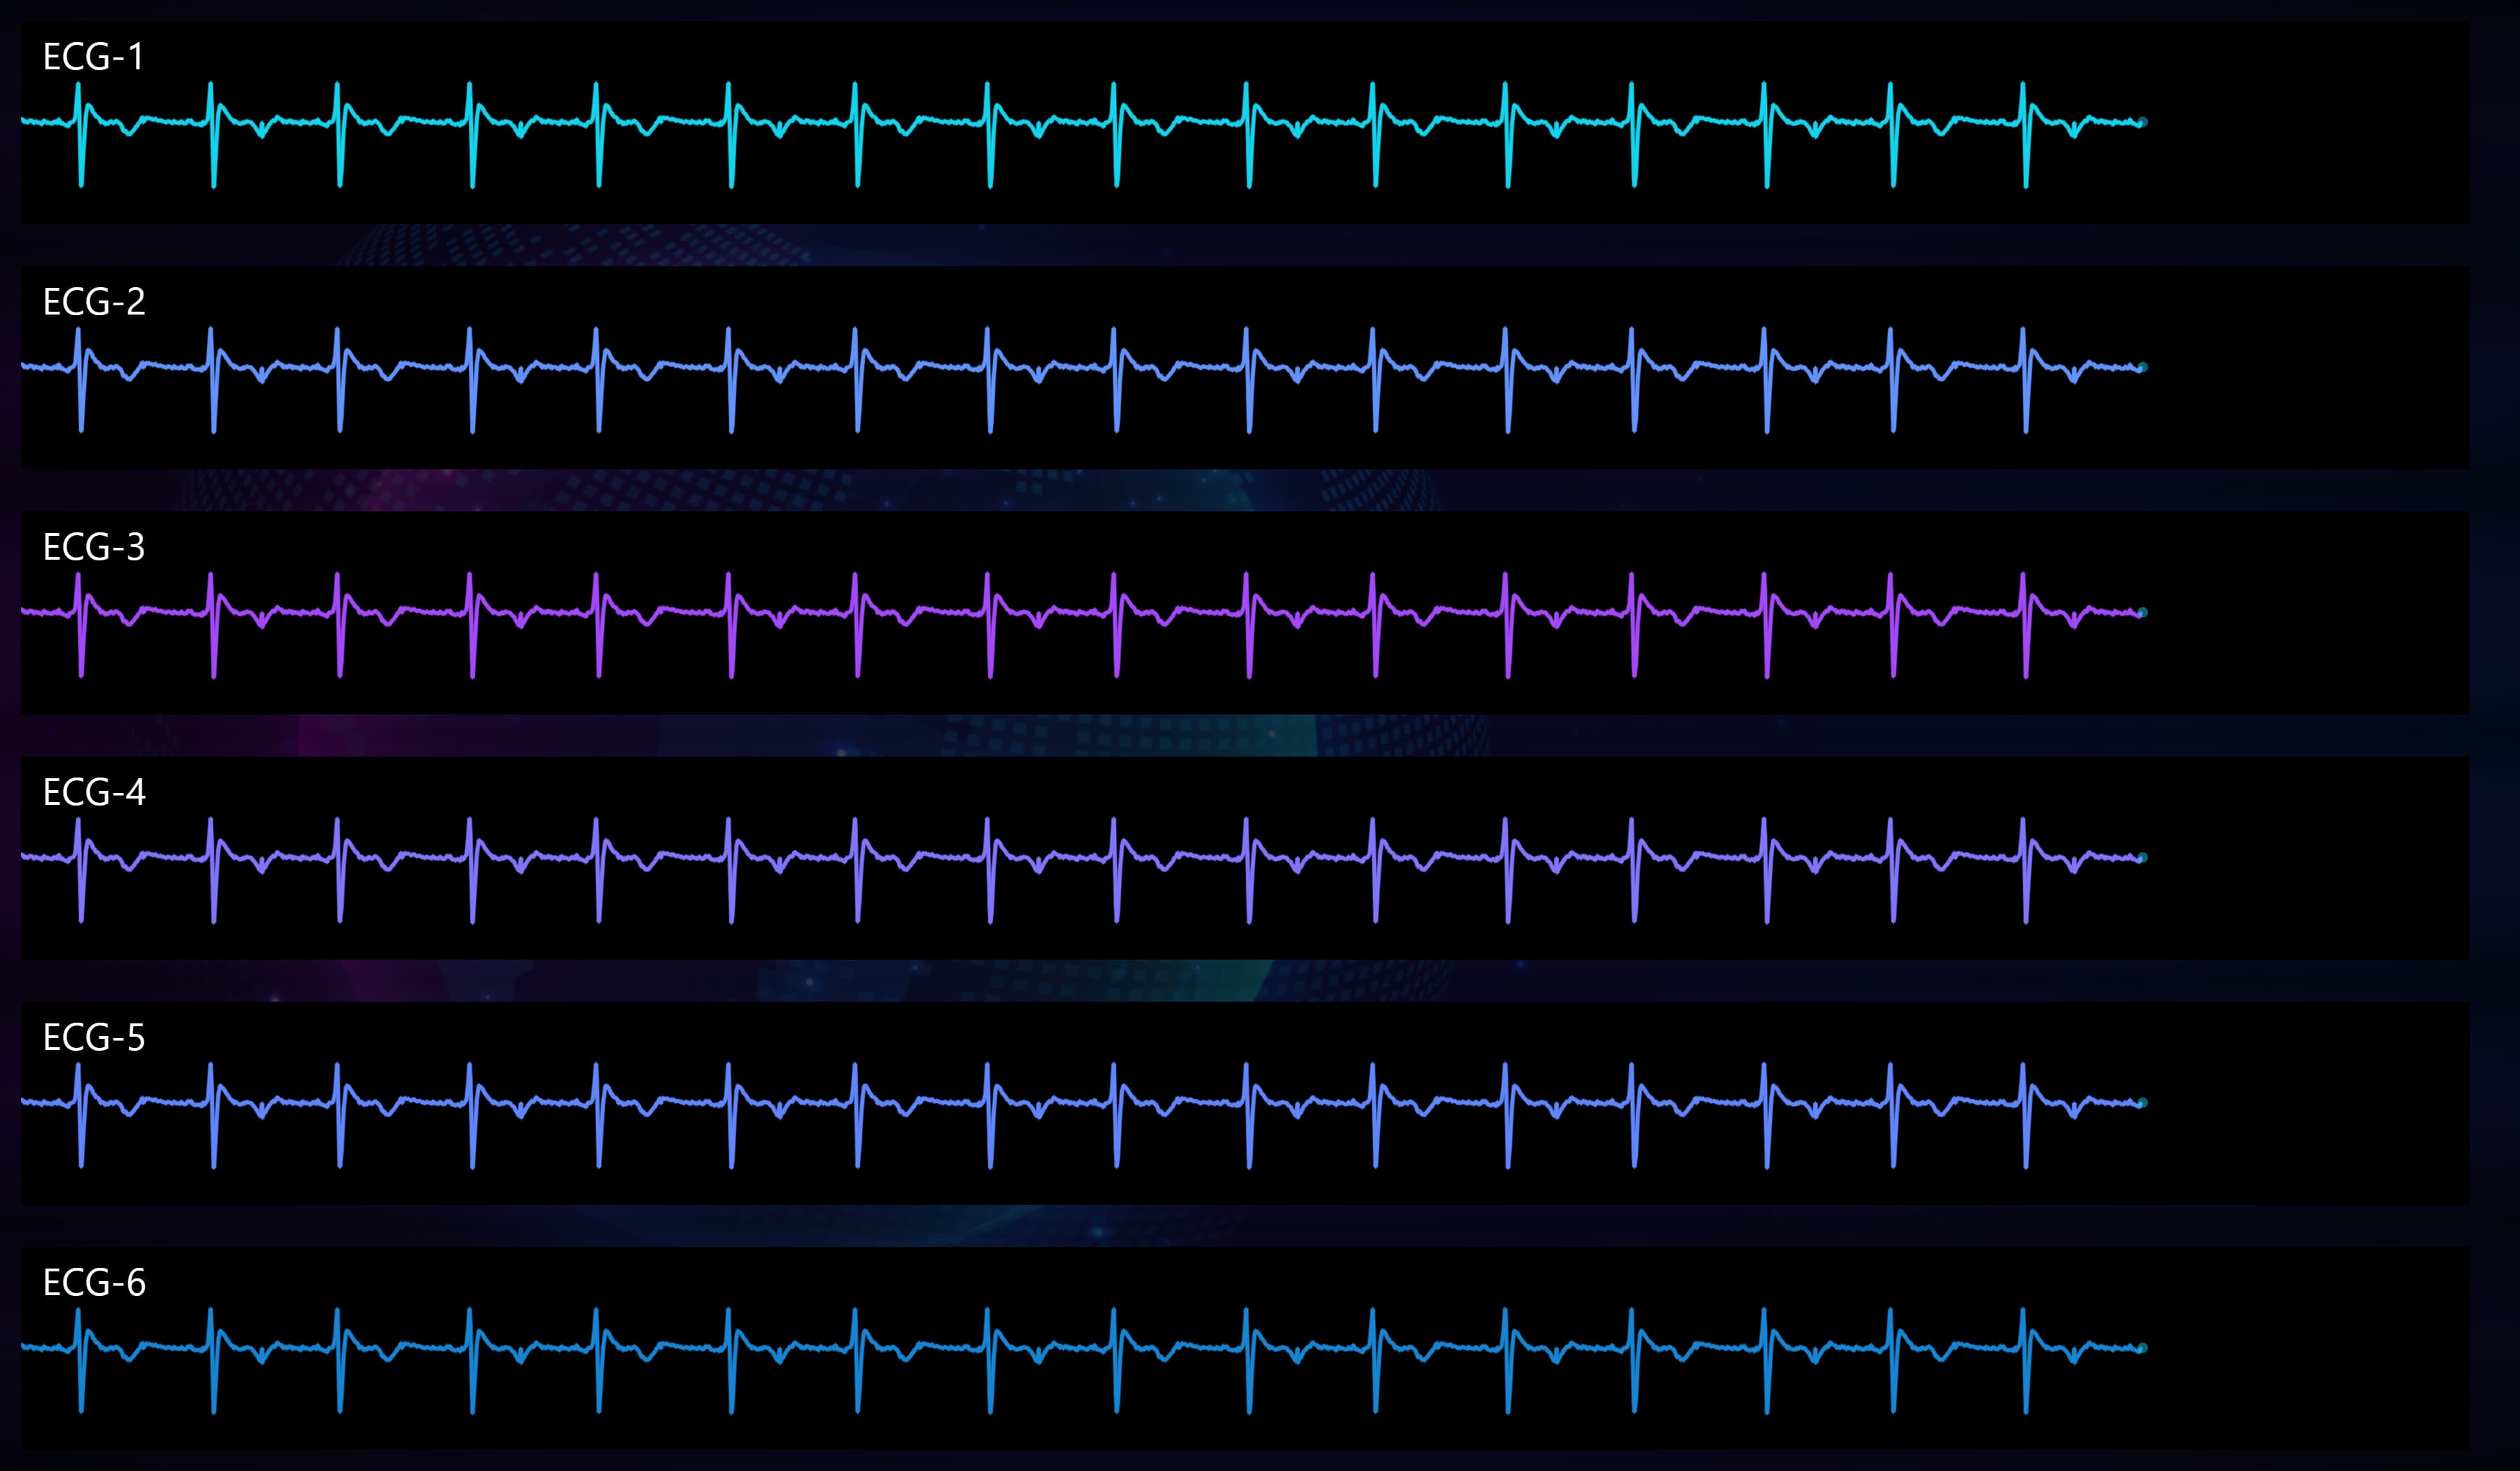
One of the major additions to LightningChart JS 4.0 is the partial support for sweeping line chart applications which are widely used in the medical industry.
Interact
Visual Improvements
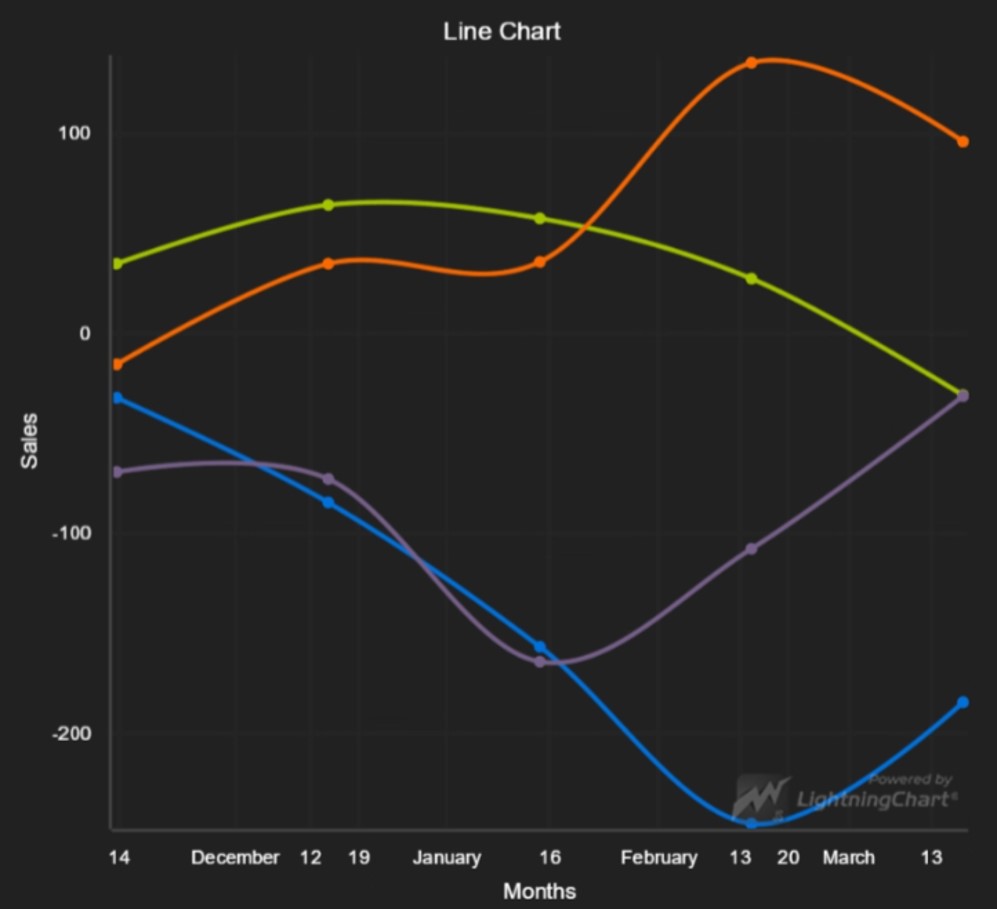
In this release, we put a special focus on detailing the looks of LightningChart JS visualizations. We’ve included:
- Fixes for reported issues with mushy, blurry or too bold text within light themes.
- Subtle shadows behind text, series, legend, default colors, styles, and fonts.
- An extra dept to visualizations for a more vivid appearance.
Notice that all these improvements do not compromise performance as LightningChart components have the power to improve design and looks without compromising a smooth user experience.
Performance Improvements
As part of this major release, we have put special attention on improving performance:
- We have seriously increased how LightningChart JS performs mouse picking interactions. For instance, a slow mouse picking uses a high volume of computational resources from the application. In this release, users can now attach custom events when a complicated visualization is clicked or dragged.
- The initial loading speed of all the charts has improved by 10-20 milliseconds. This improvement removes the difficulty of initial loading optimization for some charts.
- 3D line chart users of LightningChart JS 3.3/3.4 can now experience an performance improvement of 10x – 100x.
Developer Experience
setDrawOrder
Now developers can easily controlled what is displayed on the top and the bottom of the visualization. The setDrawOrder method solves this problem easily.

Top and bottom text annotations
Change Title Position
We are now introducing the change title position, a convenient method for end-users to moving the ChartXY title between the default and handful key locations.
Auto Cursor
Now the auto cursor works above the series. There is no longer need to disable the series interactions in order to display the cursor.
New Features
By default, most LCJS charts are interactive. The most common interactions are features like “data cursors”, “panning”, and “zooming”. Going further, it is commonly required to be able to add custom interactions to charts.
For example, clicking on a chart to add a marker, dragging on a data trend to highlight a range of the data, or hovering over data to show possible actions or more information.
Mouse Interactions
Some of the already familiar methods from 2D mouse interactions will be added to 3D interactions. Some of the methods included are onMouseMove, onMouseDrag, onTouchStart, etc.
We’ve also included new interaction performance improvements relevant for those users who might have previously disabled the interactions due to performance reasons.
Example of mouse interactions
Animated Highlighting of Focused Components
By placing the mouse over a Legend, or a component directly, it will display a highlight animation giving more life to your visualizations.
Animated Highlighting
Migrating to v.4.0
As for this major release, make sure you follow the version migration guide to quickly get familiar with the new changes and learn how to adjust them.
Get started with LightningChart JS v.4.0
See more news
Alpha Omega Engineering
Date of case study: 04/2024Industry of business: Clinical NeuroscienceEstablished: 1993LightningChart solution: XY ChartsAlpha Omega EngineeringAlpha Omega is the market leader in physiological navigation for advanced neurosurgical procedures, like deep brain...
JavaScript 2D Bubble Chart
JavaScript 2D Bubble ChartIn this article, we will create a JavaScript 2D bubble chart using Node JS and LightningChart JS. Remember that you can download the template and use it to experiment with it. When we are looking for an attractive way to represent our data,...
Create a JavaScript Stacked Bar Chart
JavaScript Stacked Bar ChartStacked bar charts are very useful in scenarios where we see large groups of data from different categories, or values from each other. We can see how a category is divided into segments, from the largest to the smallest in relation to...
3D Mesh Model Real-Time Coloring
Updated on March 19th, 2024 | Written by human3D Mesh Model Real-Time Coloring ApplicationIn this example, we will be using an airplane object for creating a 3D mesh model real-time coloring application. This application example is useful for visualizing simulations...


