Brand-New Themes for LightningChart® Interactive JavaScript Examples
14 new theme styles have been added to the Interactive JavaScript Charts Examples
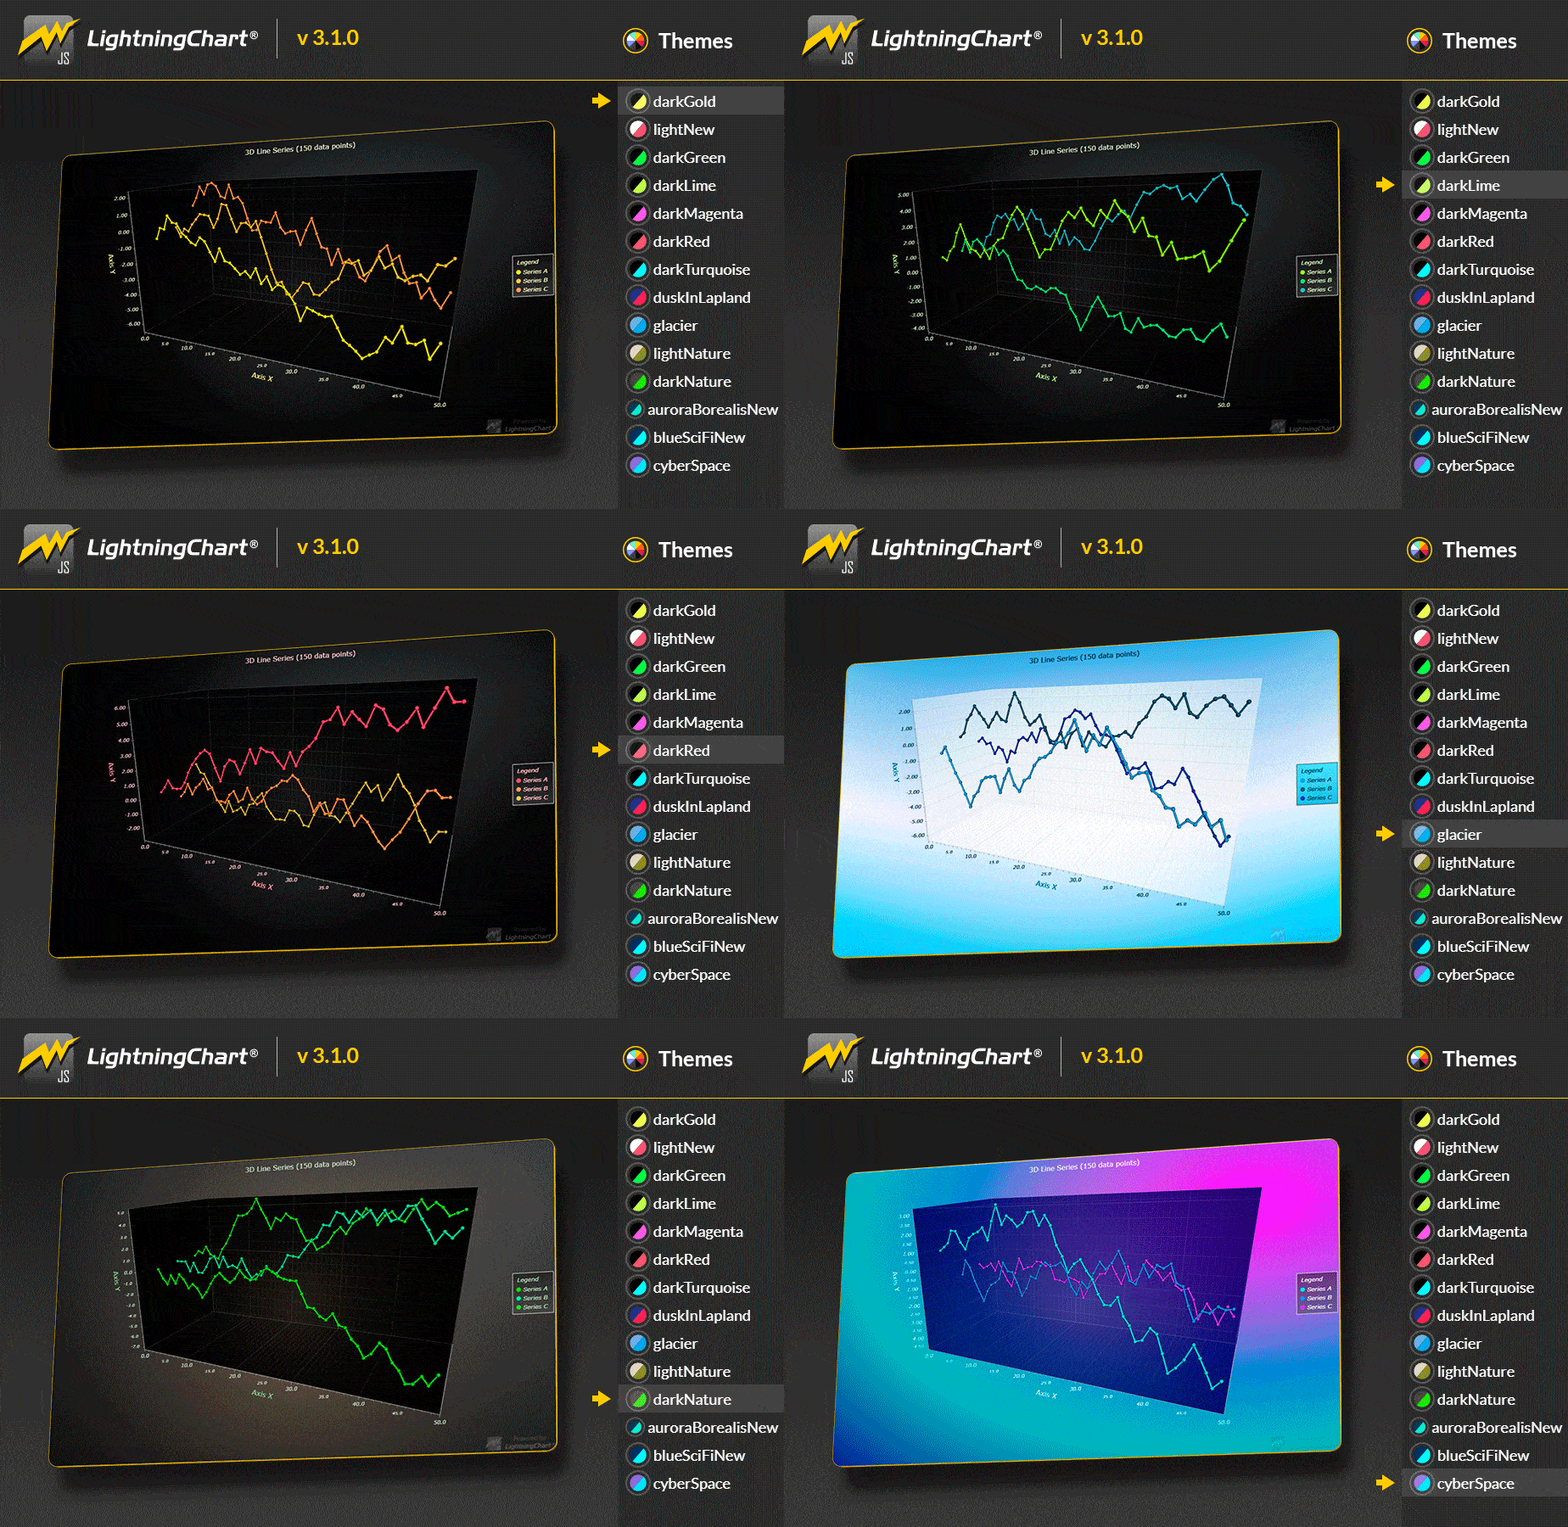
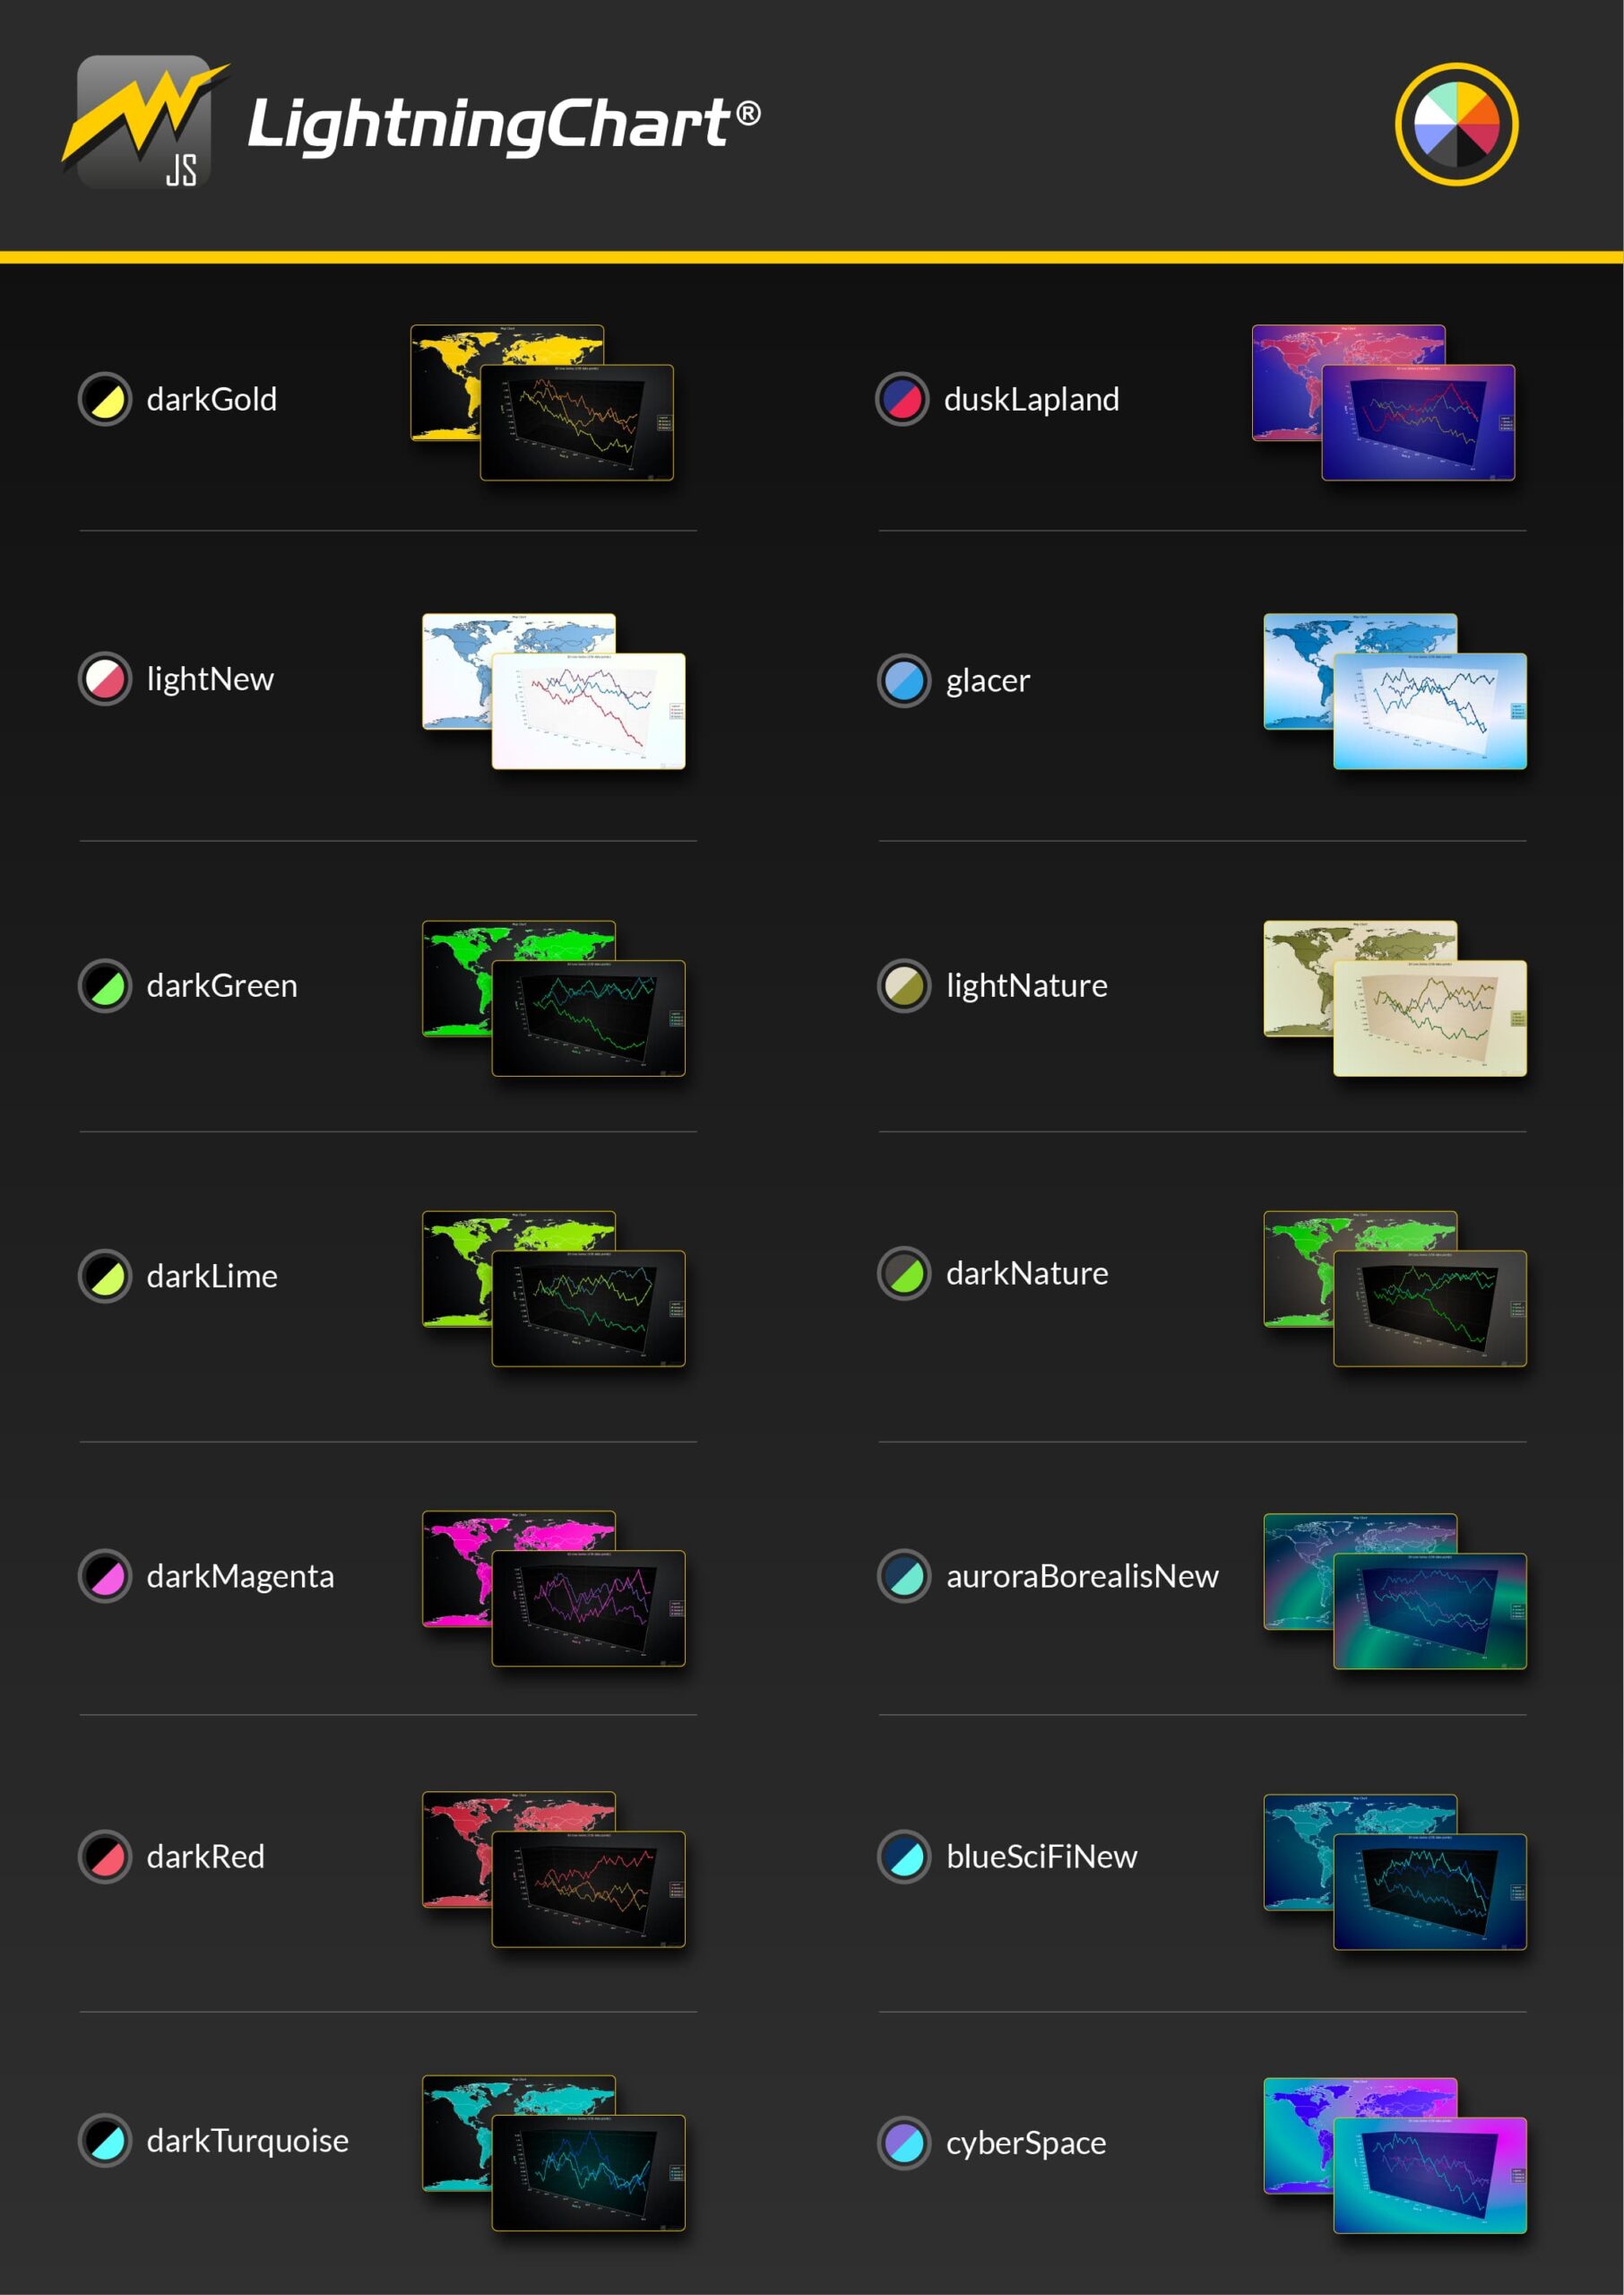
`darkGold’, `darkGreen’, or `duskInLapland’ are some of the 14 new themes for the Interactive JavaScript Charts by LightningChart® that have just been added to the Interactive Examples.
New 14 Themes Added to the Interactive JavaScript Charts Online Examples
With the introduction of LightningChart® JavaScript version 3.1.0, several new features were added, improved, fixed, and even deprecated. Important additions such as MapCharts and Heatmaps improvements highly resonate in the highest-performing charting library for JavaScript.
However, there are about 60+ enhancements you can find in the changelog and 14 of those are the new themes we’ve just added to the interactive JavaScript charts examples.

Some of these new themes are coming to replace previous versions. So every theme with the suffix `New’ will replace those with the same new without the suffix `end’.
Why Adding New Interactive JavaScript Charts Themes?
In order to continue providing the best UX to all of our users and clients, we decided to renew the aspect of our JavaScript Interactive Examples which is not only limited to the looks of these. Our 100+ chart types will also now perform better in the following aspects:
-
-
- Most Theme series style properties now support Palette definition optionally as well.
- The `OnScreenMenu` feature was added and can be used to create UI controls over the chart.
-

Figure 1. New themes added
Learn More About LightningChart® JS
To get access to the new version of LightningChart® JS v.3.1.0, including 60+ enhancements, you can download the Free Community License for no commercial purposes or see our pricing but you can always interact with the online examples for FREE!
Interact with LightningChart® JS online Interactive Examples
See more news
Alpha Omega Engineering
Date of case study: 04/2024Industry of business: Clinical NeuroscienceEstablished: 1993LightningChart solution: XY ChartsAlpha Omega EngineeringAlpha Omega is the market leader in physiological navigation for advanced neurosurgical procedures, like deep brain...
JavaScript 2D Bubble Chart
JavaScript 2D Bubble ChartIn this article, we will create a JavaScript 2D bubble chart using Node JS and LightningChart JS. Remember that you can download the template and use it to experiment with it. When we are looking for an attractive way to represent our data,...
Create a JavaScript Stacked Bar Chart
JavaScript Stacked Bar ChartStacked bar charts are very useful in scenarios where we see large groups of data from different categories, or values from each other. We can see how a category is divided into segments, from the largest to the smallest in relation to...
3D Mesh Model Real-Time Coloring
Updated on March 19th, 2024 | Written by human3D Mesh Model Real-Time Coloring ApplicationIn this example, we will be using an airplane object for creating a 3D mesh model real-time coloring application. This application example is useful for visualizing simulations...
