Introduction to creating a gold price prediction applicationThis project shows data visualization and machine learning...


Regional Account & Marketing Executive (China, Japan and South Korea)
+358 503 543 706
Book a meeting
Regional Account Manager (North America, South America)
+358 505 528 995
Book a meetingOur dedicated sales team is ready to help you find the perfect solution for your data visualization needs. Don't hesitate to reach out for personalized assistance or to schedule a demo of our products.

Regional Account & Marketing Executive (China, Japan and South Korea)
+358 503 543 706
Book a meetingRegional Account Manager (North America, South America)
+358 505 528 995
Book a meetingOur dedicated sales team is ready to help you find the perfect solution for your data visualization needs. Don't hesitate to reach out for personalized assistance or to schedule a demo of our products.
Introduction to creating a gold price prediction applicationThis project shows data visualization and machine learning...

Introduction to the ProjectIn the industrial field, we always have a huge amount of data through different events like...
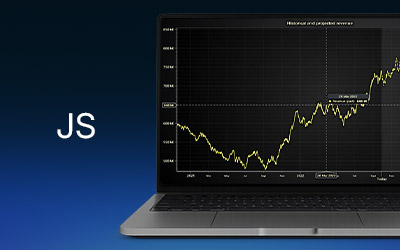
IntroductionI'm Omar, and this month we are back with LC JS, using the latest version of this library. To start off...
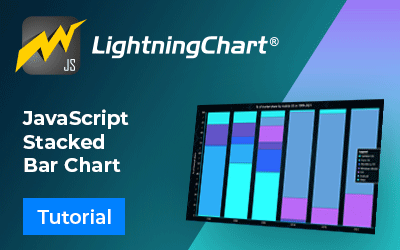
Written by a human | Updated on April 23rd, 2025JavaScript Stacked Bar ChartStacked bar charts are very useful in...
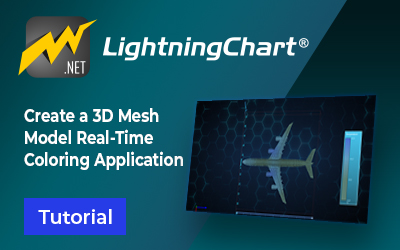
Written by a human | Updated on April 14th, 20253D Mesh Model Real-Time Coloring ApplicationIn this example, we will...
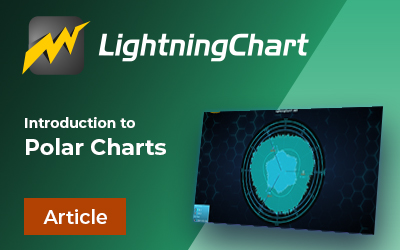
Written by a human | Updated on April 23rd, 2025Introduction to polar chartsI'm Omar and today we will review the...
Written by a human | Updated on April 23rd, 2025IntroductionHi again, I'm Omar and in this article, we will create a...

Written by a human | Updated on April 23rd, 2025JavaScript 3D Bubble ChartHello, I'm Omar and we'll start with a quick...
Written by a human | Updated on April 23rd, 2025Volume Rendering: VolumeModelsVolumeModels is a tool for volume data...

Written by a human | Updated on April 14th, 2025Introduction to aeronautical chartsIn this article, we will review a...

Written by human on February 19th, 2024Temperature sensor applicationsReal-time temperature monitoring applications...
Written by a human | Updated on April 23rd, 2025WPF 3D SphereIn this article, we will create a WPF 3D sphere globe...