Every year someone publishes a listicle of JavaScript charting libraries. They screenshot a demo, note the GitHub...


Regional Account & Marketing Executive (China, Japan and South Korea)
+358 503 543 706
Book a meeting
Regional Account Manager (North America, South America)
+358 505 528 995
Book a meetingOur dedicated sales team is ready to help you find the perfect solution for your data visualization needs. Don't hesitate to reach out for personalized assistance or to schedule a demo of our products.

Regional Account & Marketing Executive (China, Japan and South Korea)
+358 503 543 706
Book a meetingRegional Account Manager (North America, South America)
+358 505 528 995
Book a meetingOur dedicated sales team is ready to help you find the perfect solution for your data visualization needs. Don't hesitate to reach out for personalized assistance or to schedule a demo of our products.


Every year someone publishes a listicle of JavaScript charting libraries. They screenshot a demo, note the GitHub...
Every WebSocket tutorial on the internet shows the same thing: a server sends a random number every second, a chart...
If you've been searching for a JavaScript charting library, you already know the problem: comparison articles tend to...

Chart.js is the correct answer for a lot of chart projects. MIT license with no commercial restrictions, ~14KB...

AnyChart is a commercially-oriented JavaScript charting library that markets itself on enterprise reliability, used by...

Apache ECharts is an excellent charting library that's the honest starting point, and it's worth saying clearly. Free...
D3.js is the most starred data visualization library in existence 109,000+ GitHub stars and for justifiable reasons....
ApexCharts earned its position through a set of genuine strengths executed consistently well: MIT license, the best...
amCharts 5 wins on visual aesthetics. The default chart transitions are among the smoothest in the JavaScript charting...
Plotly.js holds a unique position in the JavaScript charting ecosystem. Data scientists already know it from Python,...
Highcharts has been a reliable workhorse for enterprise JavaScript charts since 2009. Solid documentation, broad chart...
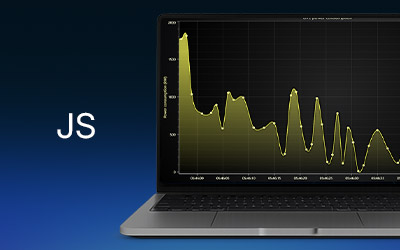
IntroductionIn this article, we'll create a Spline chart example using the LightningChart JS library. We'll also...