LightningChart .NETWPF 3D Sphere
TutorialLearn how to create a WPF 3D Sphere model of the Earth using LightningChart .NET globe chart control.
WPF 3D Sphere
In this article, we will create a WPF 3D sphere globe chart using the Lightning Chart .NET library. As we know, a WPF 3D globe chart is a 3D sphere representing the Earth that shows the Earth’s surface and three-dimensional model.
One of the main objectives of these sphere models is to show the continents, oceans, polar Regions, and in some cases, the geographical and territorial divisions of all countries, capitals, and most important cities.
There are different globe chart types; some may focus on rivers, fauna, flora, or important locations worldwide. In today’s exercise, we will create a globe where we can show the elevation of the Earth in different geographical areas.
In the SRTM-90 digital elevation data, produced by NASA, provides high-quality elevation data for many areas of the planet. This information is free for consumption and can be used in software development (as in the case of Google Earth). To develop this WPF globe chart, we will use the SurfaceMeshSeries3D mesh tool to join data points and deform them to create a WPF 3D shape from a grid.
Here we have an example of the mesh model that simulates a WPF 3D chart. In this 3D chart example, we’re simulating a value-based 3D contouring 3D chart:
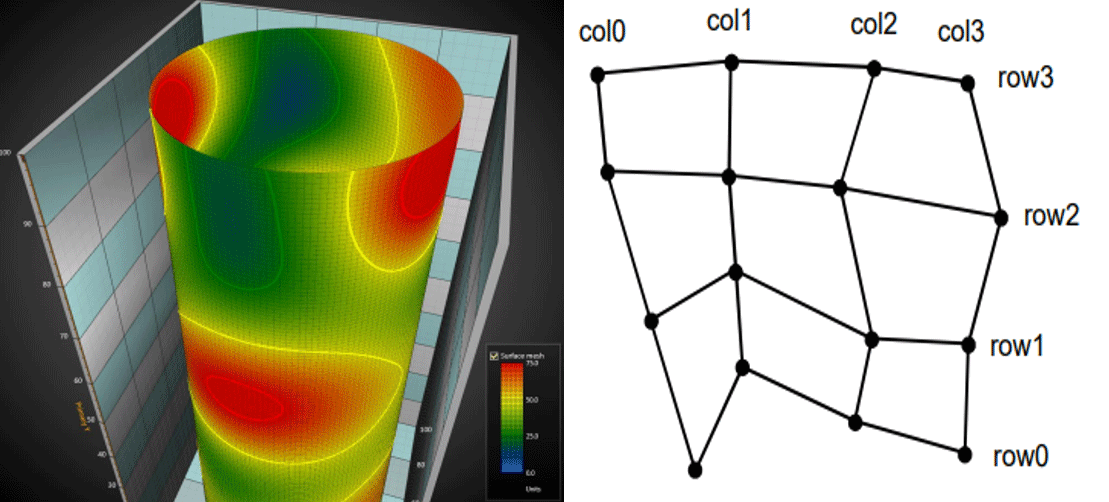
Previously, we already worked with the SurfaceMeshSeries3D where we created a human head-brain model, an article that I recommend you to take a look at. Among other tools, we will use PointLineSeries3D, which is a tool that allows you to present points and lines in a 3D space. Points are connected with a line if the LineVisible property is set to true.
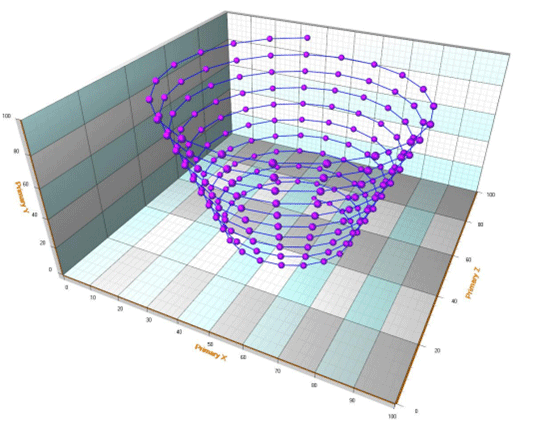
Given this brief introduction, we can begin creating this WPF 3d globe chart project. This template includes the XAML file and Visual Studio project.
Project Video Demo
Today we will create a Globe chart demo application using the SurfaceMeshSeries3D using LightningChart .NET.
Download the project to follow the tutorial
Local Setup
For this project, we need to consider the following requirements to compile the project.
- OS: 32-bit or 64-bit Windows Vista or later, Windows Server 2008 R2 or later.
- DirectX: 9.0c (Shader model 3 and higher) or 11.0 compatible graphics adapter.
- Visual Studio: 2010-2019 for development, not required for deployment.
- Platform .NET Framework: installed version 4.0 or newer.
Now go to the next URL and download LightningChart .NET. You’ll then be redirected to a sign-in form where you’ll have to complete a simple sign-up process to get access to your LightningChart account.
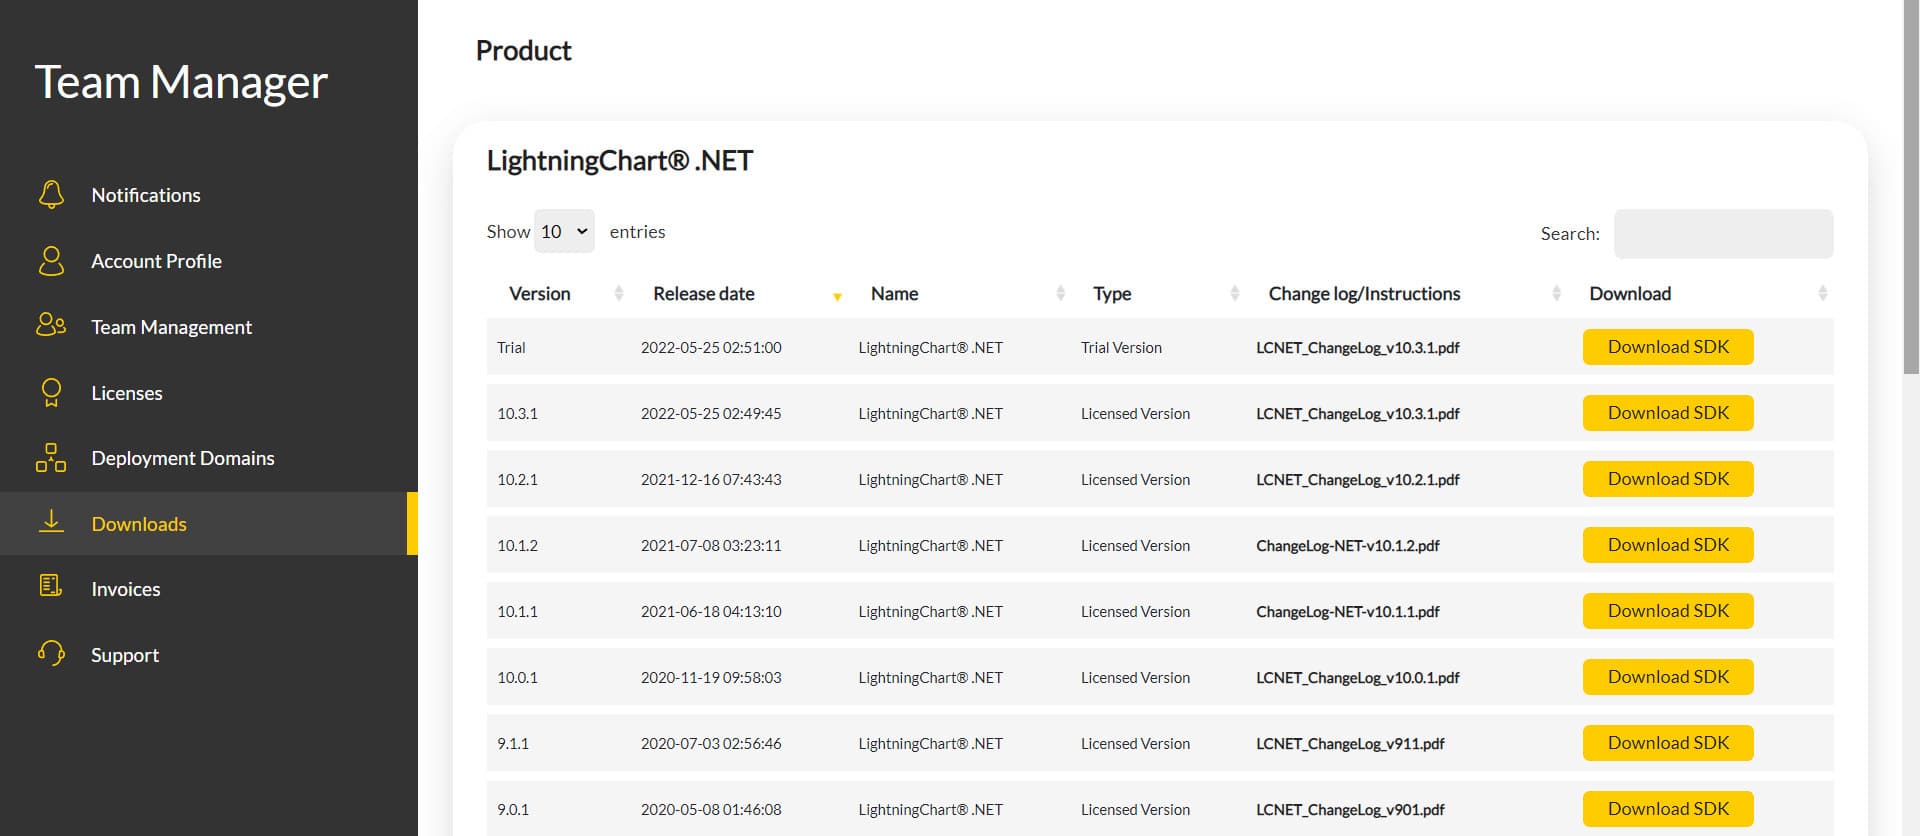
After signing in to your account, you can download the SDK “free trial” version that allows you to use important features for this WPF 3D Sphere chart tutorial. When you download the SDK, you’ll have a .exe file like this:

The installation will be a typical Windows process, so please continue with it until it is finished. After the installation, you will see the following programs:

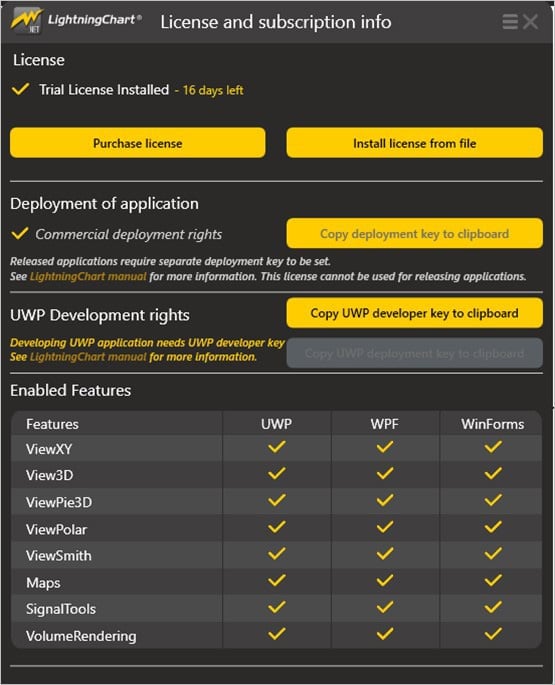
License Manager
In this application, you will see the purchase options. All the projects that you will create with this trial SDK, will be available for future developments with all features enabled.
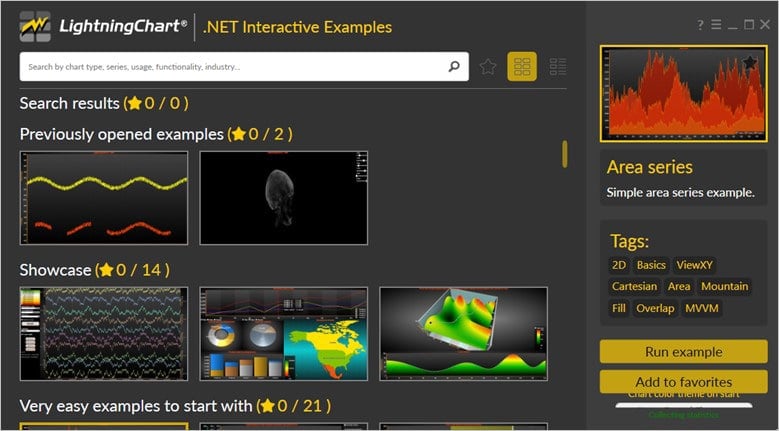
LightningChart .NET Interactive Examples
You can see 100+ interactive visualizations for WPF, WinForms, and/or UWP.
Visual Studio Project
The main difference between the LightningChart visualizer and Visual Studio is that we can analyze and experiment with many features within the source code. In the LC visualizer, select the “Globe chart” sphere GUI example and run it:

In the top-right zone of the windows, you will see the following options:
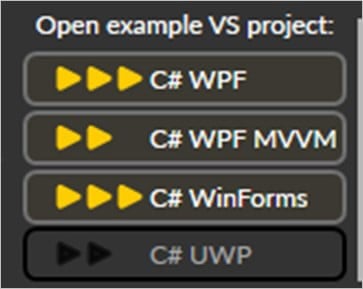
The SDK trial allows us to use the WPF framework. After selecting the right framework, we need to specify a folder where to create the project:
After creating the project, Visual Studio will open and be ready for execution.
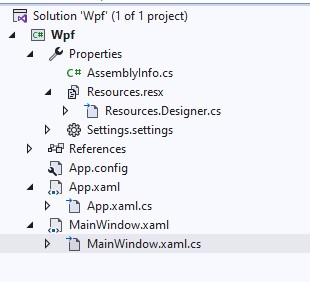
XAML Code Review
The main XAML code will be wrapped inside MainWindow.xaml.cs and contains the code of the sphere GUI controls.
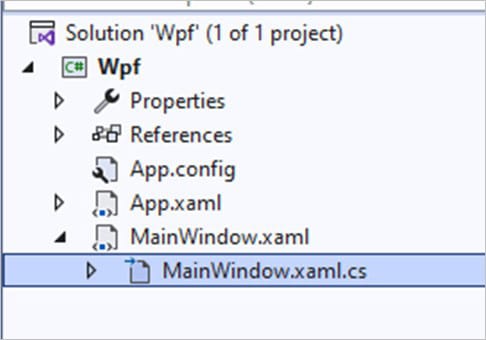
Inside the code, we will check two methods for creating the properties needed to draw the chart correctly. The interactive example is built with various user controls to manipulate and change the visual properties of the chart. These controls are not required to generate this graph, so we will focus on the code responsible for generating the object.
Initializing
_elevationData = null;
            _chart = null;

            InitializeComponent();
            Uri uri = new Uri(Environment.CurrentDirectory + "\\Resources\\WorldPhoto3600x1800.jpg");
            m_photo = BitmapFrame.Create(uri);
            CreateChart();
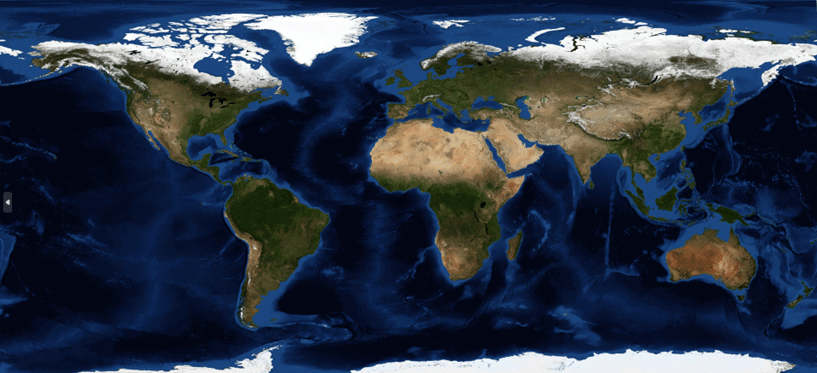
We will start with the InitializeComponent method to load our XAML template and access its objects. To create our world map, we need to decode/encode an image of it. For this, we will use the BitmapFrame abstract class by sending the image of the world. As you can see, there is a route within our PC; in my case it is:
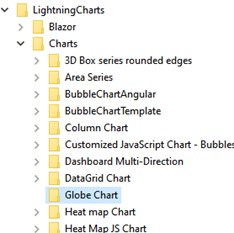
C:\LightningCharts\Charts\Globe Chart\Wpf\ExampleGlobeSurface3D\bin\Debug\Resources
Depending on where you have the LightningChart .NET framework installed, this may change in the root of the path. If you open the file, you will see an image like this:
After the CreateChart() method, you will see the assignment of some properties to some variables.
_elevationData = null;
            _chart = null;

            InitializeComponent();
            Uri uri = new Uri(Environment.CurrentDirectory + "\\Resources\\WorldPhoto3600x1800.jpg");
            m_photo = BitmapFrame.Create(uri);
            CreateChart();

            m_comboBoxCameraValueChanged = new SelectionChangedEventHandler(ComboBoxCamera_SelectionChanged);
            m_comboBoxProjectionValueChanged = new SelectionChangedEventHandler(comboBoxProjection_SelectionChanged);
            m_distanceSliderValueChanged = new RoutedPropertyChangedEventHandler<double>(sliderDistance_ValueChanged);
            m_horizontalSliderValueChanged = new RoutedPropertyChangedEventHandler<double>(sliderHorizontalRotation_ValueChanged);
            m_sideSliderValueChanged = new RoutedPropertyChangedEventHandler<double>(sliderSideRotation_ValueChanged);
            m_verticalSliderValueChanged = new RoutedPropertyChangedEventHandler<double>(sliderVerticalRotation_ValueChanged);
These variables correspond to the 3D chart user controls in the XAML template, and each one will allow us to manipulate the visual properties of the globe.

WPF Mapping: CreateChart()
This method creates the WPF 3D chart object displayed within the XAML frame. Then, we need to create a LightningChart type object. This constructor will allow us to create an instance of a WPF chart, specify the type of WPF chart, and access different properties.
_chart = new LightningChart
            {
                ChartName = "Globe chart"
            };

            _chart.BeginUpdate();
The BeginUpdate function allows us to stop drawing the chart and set up the properties we want to customize. As long as the update is not closed, the WPF chart will not show the changes we make. This will help with the performance of the WPF 3D chart construction.
_chart.ActiveView = ActiveView.View3D;Now, we need to specify the active chart view or the type of WPF chart that will be created. In this case, we use the 3D view, but there are several types of views, including:
- XY
- 3D
- Pie3D
- Polar
- Smith
List<WallBase> listWalls = _chart.View3D.GetWalls();
            foreach (WallBase wall in listWalls)
            {
                wall.Visible = false;
            }
Now, we will hide the walls of the WPF 3D chart. In a chart, the walls represent axis grids and grid strips and give a base for the axes. With the property Visible = false, we can hide these walls to only show the globe mesh model.
_chart.View3D.XAxisPrimary3D.SetRange(-EarthDiameterKm, EarthDiameterKm);
            _chart.View3D.YAxisPrimary3D.SetRange(-EarthDiameterKm, EarthDiameterKm);
            _chart.View3D.ZAxisPrimary3D.SetRange(-EarthDiameterKm, EarthDiameterKm);
We now set a range for the X, Y, and Z axes and use the Earth’s radius in kilometers. If we search on Google, the Earth’s diameter is around 12,742 km so we will set the radius to 6371 km. This value is what we will use for the range. Now, we set the size of the 3D model. The walls and the axes will be defined by the size of the box:
_chart.View3D.Dimensions.Width = 200;
            _chart.View3D.Dimensions.Height = 200;
            _chart.View3D.Dimensions.Depth = 200;
Now, we establish a position and initial approach to the perspective of the camera:
_chart.View3D.Camera.MinimumViewDistance = 10;
            _chart.View3D.Camera.SetPredefinedCamera(PredefinedCamera.FrontPerspective);
            _chart.View3D.Camera.ViewDistance = 200;
            _chart.View3D.Camera.RotationX = 60;
            _chart.View3D.Camera.RotationY = -25;
            _chart.View3D.Camera.OrientationMode = OrientationModes.XYZ_Mixed;
We will use a perspective located in the negative Z space and oriented towards the center of the 3D model. The Y-dimension is vertical, and the X-dimension is horizontal.
List<Axis3DBase> listAxes = _chart.View3D.GetAxes();
            foreach (Axis3DBase axis in listAxes)
            {
                axis.Visible = false;
            }
We will hide the axes so that only the 3D model is shown in the window.
Data and Series
MakeElevationData()
We will use an image to generate a bitmap to help us generate elevation values. If we go to the following directory, we will see a black-and-white image of the Earth:
@”\Resources\WorldElevation1024x512.png”

With this image, the method will obtain the colors and determine the elevation values based on them.
Lighter colors will represent higher elevation values whereas darker colors will represent lower values.
System.Drawing.Color[,] aElevationData = ChartTools.GetPixelColors(bitmapElevation);

            int width = aElevationData.GetLength(0);
            int iHeight = aElevationData.GetLength(1);

            _elevationData = new double[width][];

            for (int column = 0; column < width; column++)
            {
                _elevationData[column] = new double[iHeight];

                for (int row = 0; row < iHeight; row++)
                {
                    _elevationData[column][row] =
                        (aElevationData[column, row].R + aElevationData[column, row].G + aElevationData[column, row].B) / (3.0 * 255.0);
                }
            }
CreateSurfaceSeries()
This method will allow us to create the globe WPF chart. We need to create an instance of SurfaceMeshSeries3D, to which we will assign the bitmap of the color image of the Earth. Then, we will assign some visual properties, remove some lines, adjust saturation, etc.
SurfaceMeshSeries3D surface = new SurfaceMeshSeries3D(_chart.View3D, Axis3DBinding.Primary, Axis3DBinding.Primary, Axis3DBinding.Primary)
            {
                Fill = SurfaceFillStyle.Bitmap
            };
            surface.BitmapFill.Image = m_photo;
            surface.BitmapFill.MirrorHorizontal = false;
            surface.BitmapFill.MirrorVertical = true;
            surface.WireframeType = SurfaceWireframeType3D.None;
            surface.ContourLineType = ContourLineType3D.None;
            surface.ColorSaturation = 80;
Now we will generate the X-Z values:
int slices = _elevationData.GetLength(0);
            int stacks = _elevationData[0].GetLength(0);

            surface.SizeX = slices;
            surface.SizeZ = stacks;

for (int stackIndex = 0; stackIndex < stacks; stackIndex++)
            {
                phi = Math.PI / 2.0 - stackIndex * Math.PI / (stacks - 1);
                for (int sliceIndex = 0; sliceIndex < slices; sliceIndex++)
                {
                    elevation = _elevationData[sliceIndex][stackIndex] * elevationFactor;

                    y = (radius + elevation) * Math.Sin(phi);

                    scale = -Math.Cos(phi) * (radius + elevation);

                    theta = -sliceIndex * 2.0 * Math.PI / (slices - 1) - Math.PI;

                    x = scale * Math.Sin(theta);
                    z = scale * Math.Cos(theta);

                    data[sliceIndex, stackIndex].X = x;
                    data[sliceIndex, stackIndex].Y = y;
                    data[sliceIndex, stackIndex].Z = z;
                }
            }
If the number of stacks is not exceeded, we will generate slices with values for the X, Y, and Z axes. These values are calculated based on the Earth radius that was previously specified. With the help of the PI value, we will generate values to create the volume of the sphere.
Lastly, the SurfaceMeshSeries3D instance, with all the specified values and parameters, is added to our 3D WPF chart.
_chart.EndUpdate();
_chart.Loaded += _chart_Loaded;
gridChart.Children.Add(_chart);
Once we have finished configuring our chart, we close the EndUpdate() update the process, and add the chart object to our XAML grid so that it is displayed.
Annotations
Now we will create some annotations on our globe chart, these annotations will show the distance between distances on the globe:
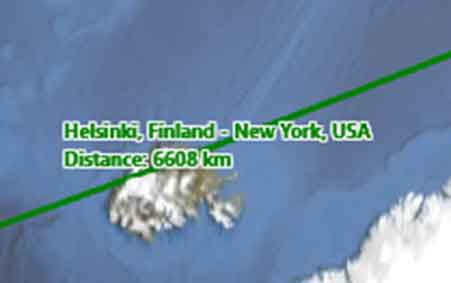
The CreateRoutes() method will generate three routes between Helsinki, Los Angeles, and Melbourne. We will use the LightningChart struct called MapCoordinate, which helps us create a WPF chart object with longitudes and latitudes to locate our points in the 3D grid.
private void CreateRoutes()
        {
            //Route1 : Helsinki, Finland - New York, USA
            MapCoordinate[] route1WayPoints = new MapCoordinate[2];
            route1WayPoints[0] = new MapCoordinate(60, 10, 0, LatitudePostfix.N, 24, 53, 0, LongitudePostfix.E);
            route1WayPoints[1] = new MapCoordinate(40, 47, 0, LatitudePostfix.N, 73, 58, 0, LongitudePostfix.W);
            CreateRoute(route1WayPoints, Colors.Green, new string[] { "Helsinki, Finland", "New York, USA" });

            //Route2: Los Angeles, USA - Tokyo, Japan - Zürich, Switzerland
            MapCoordinate[] route2WayPoints = new MapCoordinate[3];
            route2WayPoints[0] = new MapCoordinate(34, 37, 4, LatitudePostfix.N, 117, 50, 1, LongitudePostfix.W);
            route2WayPoints[1] = new MapCoordinate(35, 40, 60, LatitudePostfix.N, 139, 46, 0, LongitudePostfix.E);
            route2WayPoints[2] = new MapCoordinate(47, 22, 0, LatitudePostfix.N, 8, 33, 0, LongitudePostfix.E);
            CreateRoute(route2WayPoints, Colors.Red, new string[] { "Los Angeles, USA", "Tokyo, Japan", "Zürich, Switzerland" });

            //Melbourne, Australia - Wellington, New Zealand - Sao Paulo, Brazil
            MapCoordinate[] route4WayPoints = new MapCoordinate[3];
            route4WayPoints[0] = new MapCoordinate(37, 48, 49, LatitudePostfix.S, 144, 57, 47, LongitudePostfix.E);
            route4WayPoints[1] = new MapCoordinate(41, 17, 20, LatitudePostfix.S, 174, 46, 38, LongitudePostfix.E);
            route4WayPoints[2] = new MapCoordinate(23, 31, 60, LatitudePostfix.S, 46, 37, 0, LongitudePostfix.W);
            CreateRoute(route4WayPoints, Colors.Blue, new string[] { "Melbourne, Australia", "Wellington, New Zealand", "Sao Paulo, Brazil" });
        }
The CreateRoute method will calculate the distances, paint the lines, and return the distance values in KM. To generate the lines, we will use the PointLineSeries3D constructor:
PointLineSeries3D lineSeries = new PointLineSeries3D(_chart.View3D, Axis3DBinding.Primary, Axis3DBinding.Primary, Axis3DBinding.Primary)
                {
                    PointsVisible = false,
                    LineVisible = true
                };
                lineSeries.LineStyle.Width = 0.2f;
                //lineSeries.LineStyle.FastLine = false;
                lineSeries.LineStyle.Color = lineColor;
This constructor requires the following parameters:
- the object under construction
- the X-axis
- the Y-axis
- the Z axis
Once we have an instance of the serial line, we can configure the visual properties, such as the colors of the lines. The colors have been sent as parameters in CreateRoutes:
CreateRoute(route4WayPoints, Colors.Blue,To calculate the routes, we will use the CalculateSphericalRoute() tool, which is included in the LC .NET library. This tool returns Route waypoints, and to do so it requires the following parameters:
- Route begin to coordinate
- Route end coordinate
- Sphere radius
- Angle step
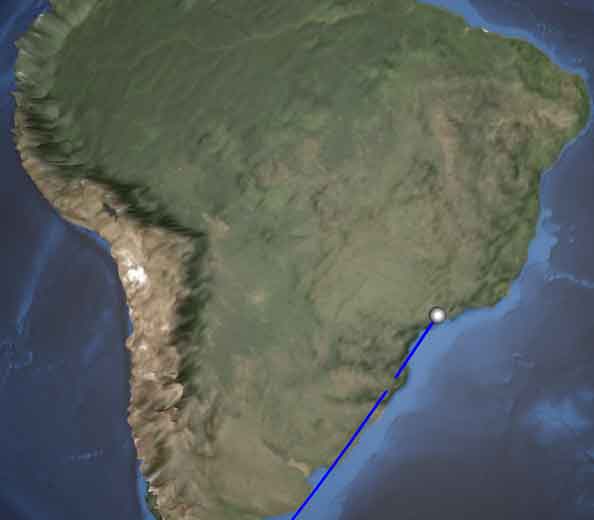
MapCoordinate[] coords = ChartTools.CalculateSphericalRoute(wayPoints[iLeg], wayPoints[iLeg + 1], Radius, AngleStep);Within the sphere, you will be able to see the coordinate points as 3D points:
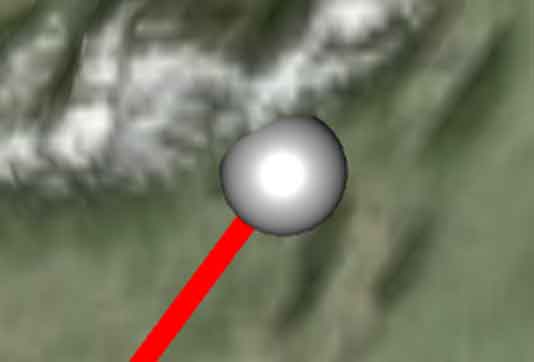
These points are generated with the property ConvertMapCoordTo3DPointOnSphere(). This only requires the coordinate and radius of the point to be created on the globe chart surface. Now, we will create the annotations for each generated route:
Annotation3D label = new Annotation3D(_chart.View3D, Axis3DBinding.Primary, Axis3DBinding.Primary, Axis3DBinding.Primary);
                    label.Fill.Style = RectFillStyle.None;
                    label.Shadow.Visible = false;
                    label.BorderVisible = false;
                    label.Style = AnnotationStyle.Rectangle;
                    label.TextStyle.Color = lineColor;
                    label.LocationCoordinateSystem = CoordinateSystem.RelativeCoordinatesToTarget;
                    label.LocationRelativeOffset.SetValues(0, 0);
                    label.AllowUserInteraction = false;
                    label.TextStyle.Font = new WpfFont("Segoe UI", 9, true, false);
                    label.TextStyle.Shadow.Style = TextShadowStyle.HighContrast;
                    label.TextStyle.Shadow.ContrastColor = Color.FromArgb(200, 255, 255, 255);
                    label.Text = wayPointNames[iLeg] + " - " + wayPointNames[iLeg + 1] + "\nDistance: " + dDistanceKm.ToString("0") + " km";
We will use the Annotation3D constructor to create the labels. If you look closely, the configuration is the usual one for a text label, for example, borders, shadows, colors, fonts, etc.
The distance is a concatenation of the “Distance” string plus the distance between points. To obtain this value, we will use the CalculateMapDistance() tool to calculate the distance between two map coordinates.
double dDistanceKm = ChartTools.CalculateMapDistance(wayPoints[iLeg], wayPoints[iLeg + 1]);Each annotation is added to the list of annotations of our chart:
_chart.View3D.Annotations.Add(label);3D series lines are also added to the 3D line series list of our 3D view:
_chart.View3D.PointLineSeries3D.Add(pointSeries);Conclusion
Up to this point, we have covered the logic of our globe 3d chart demo application.
- First, we need an image that will be converted into a bitmap.
- This bitmap will be superimposed on a grid to be manipulated to give it a spherical shape.
- Annotations are text fields that are created over coordinates on the map.
- Coordinate points are images with a 3D effect.
- Distance lines are lines drawn on the map, but using the 3D series property. They allow us to manipulate their shape compared to the shape of the 3D grid.
- The spherical route calculation tool generates the distance values between the start and end points by adding curvature to the line to adapt to a sphere.
Here’s the final application:
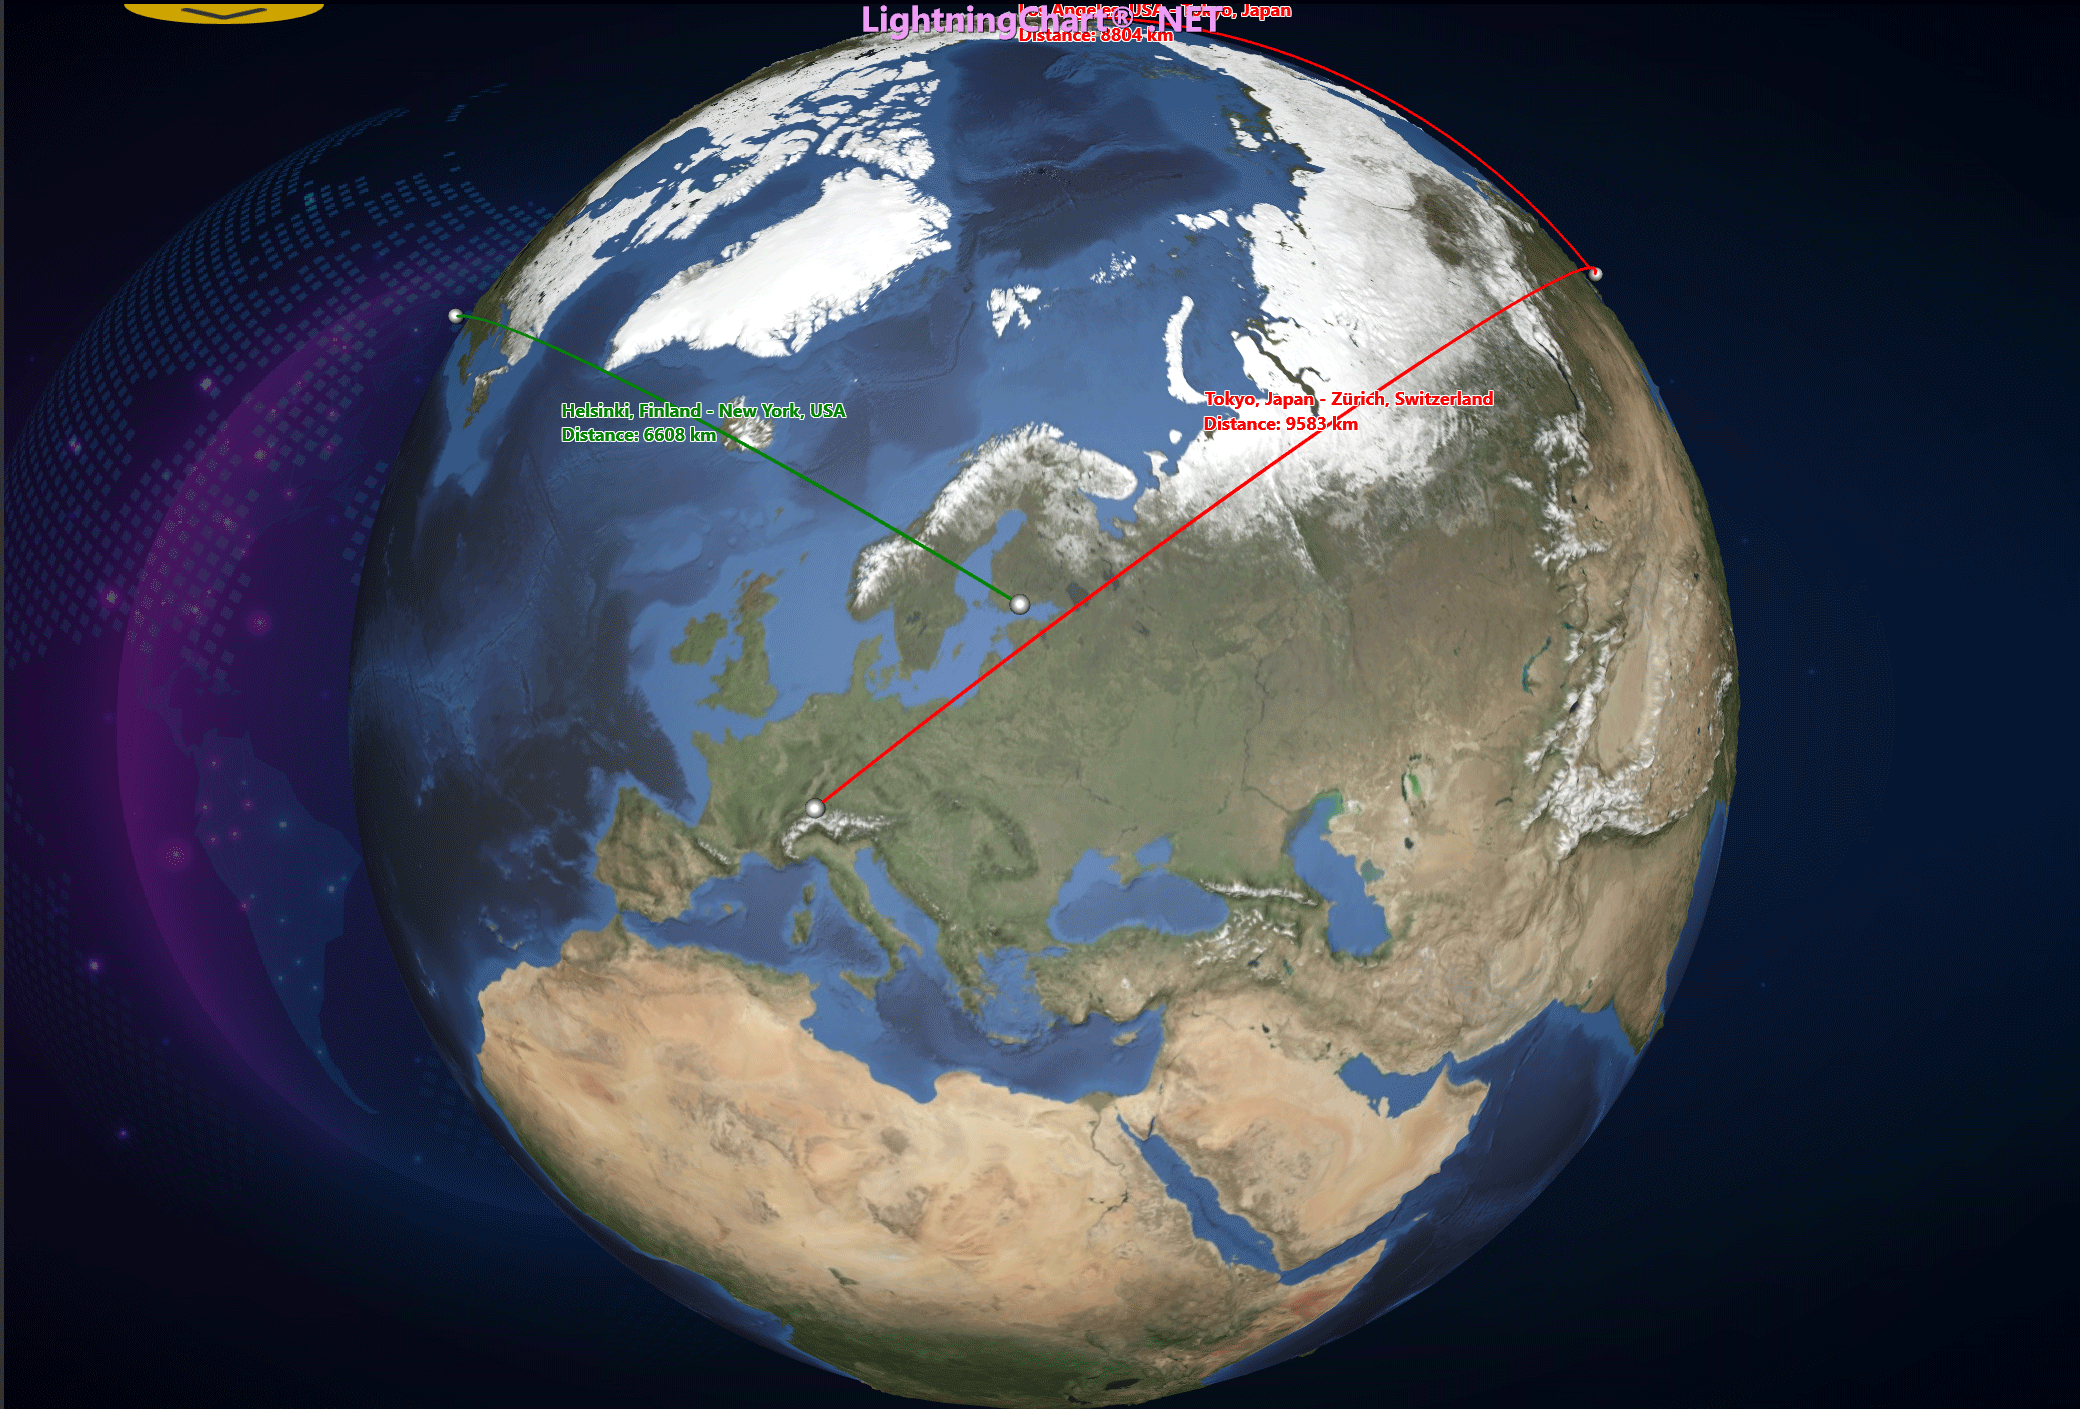
This exercise is the first in a series of articles related to 3D rendering of the Earth. Carrying out this type of development from scratch can be very complicated, but LightningChart .NET provides different tools including 2D charts and 3D charts that make these developments much easier. It allows us to focus on creating user controls to offer a more robust and complex tool.
Remember that it is possible to combine multiple charts, in this case adding XAML frameworks for each one. Later, we will create a world map to show the population of each country. Imagine combining this map with the globe… it sounds very interesting, right?
I recommend you stay tuned for future articles. With each article, you will gain a better understanding of the use of grid tools, 3D points, and generally WPF charts that LightningChart .NET has to offer.

