LightningChart .NETCreate a 3D Mesh Model Real-Time Coloring Application
TutorialLearn how to apply dynamic data coloring to a 3D mesh model with LightningChart .NET
Updated on March 19th, 2024 | Written by human
3D Mesh Model Real-Time Coloring Application
In this example, we will be using an airplane object for creating a 3D mesh model real-time coloring application. This application example is useful for visualizing simulations or diagnostic data from a 3D model in real-time. For instance, sensors connected to machinery can transmit data to a 3D model and provide real-time measurements.
In this article, we’ll create a WPF 3D mesh model real-time coloring application based on a 3D mesh model of an aircraft. This type of chart is helpful for enhanced situational awareness. In this example, temperature data is measured at certain points of the airplane model and the temperature reading is converted to the color of the pixel/3D model.
This application can assist pilots with a clear visual representation of the proximity of other aircraft in the surrounding airspace. For example, in the aviation industry, these charts based on 3D mesh models can improve situational awareness and help pilots avoid potential aircraft collisions.
A WPF 3D mesh model real-time coloring chart can also improve communication between pilots and air traffic controllers. You can think of charts in the aviation industry as a visual reference to the location of other aircraft.
Of course, decision-making benefits from the real-time nature of the visualization when making informed decisions about how to adjust a flight path to maintain a safe distance from other objects. This generally helps to improve flight safety and efficiency.
Project Video Demo
In this project, we will work with a little bit of 3D modeling. We will have to load our premade 3D object (the airplane). Then we will use the mesh mapping tools that already LightningChart .NET provides.
Just to mention, LightningChart .NET allows us to easily create 3D objects using the properties mentioned in this article which I will explain in detail.
As a reference, a 3D mesh model creates the model from a base of polygons. So, for a 3D object, we need to use X, Y, and Z coordinates which will represent height, width, and depth for the aviation chart model.
Download the project to follow the tutorial
Local Setup
For this polar chart project, we need to take in count the following requirements to compile the project.
-
OS: 32-bit or 64-bit Windows Vista or later, Windows Server 2008 R2 or later.
-
DirectX: 9.0c (Shader model 3 and higher) or 11.0 compatible graphics adapter.
-
Visual Studio: 2010-2019 for development, not required for deployment.
-
Platform .NET Framework: installed version 4.0 or newer.
Now go to the next URL and click the download button: http://lightningchart.com/net-charts/

You will be redirected to a sign in form, from then on, the process is very simple to follow. So, after confirming your email, you will have access to your own LightningChart account.
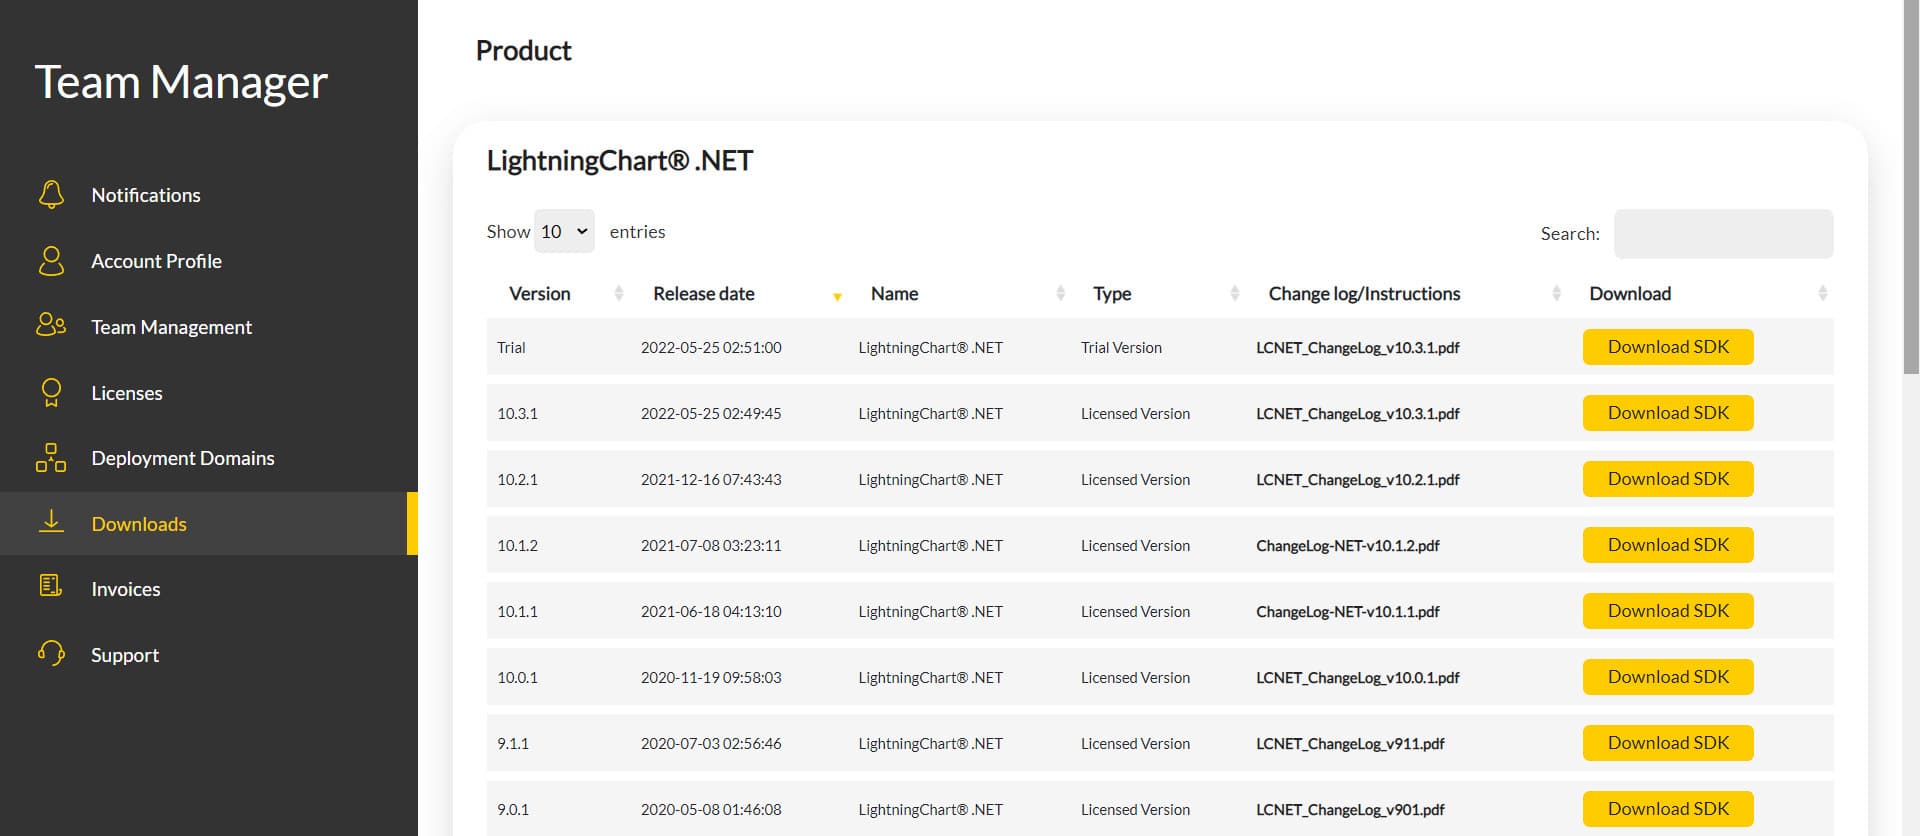
After you sign into your account, you will be able to download the SDK. This SDK will be a "free trial" version, but you will be able to use many important features.
If you download the SDK, you will have an .exe like this:

The installation will be a typical Windows process, so please continue with it until it is finished. After the installation, you will see the following programs:

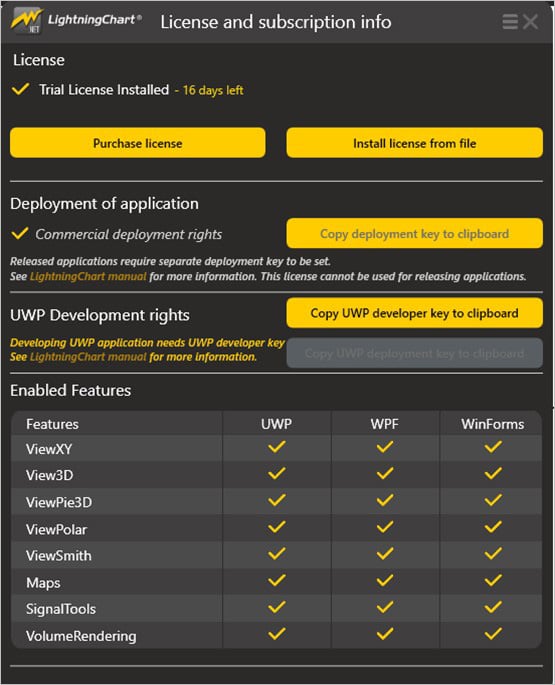
License Manager: In this application, you will see the purchase options. All the projects that you will create with this trial SDK, will be available for future developments with all features enabled.
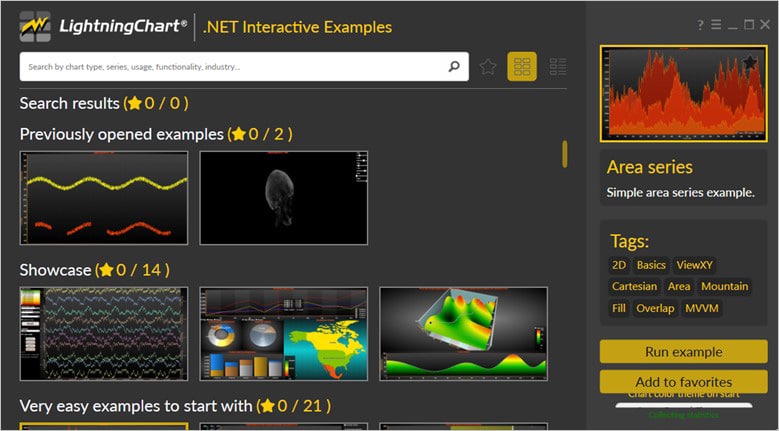
LightningChart .NET Interactive Examples: now you can see 100+ interactive visualizations available for WPF, WinForms, and/or UWP though today we’re working with Smith Charts.
Visual Studio Project
Now let’s work with visual studio. The main difference between using the LightningChart .NET visualizer and Visual Studio, is that we will be able to analyze and experiment with many features in the source code. In the LC visualizer, select the airplane colored and run the example:

In the top-right zone of the windows, you will see the following options:
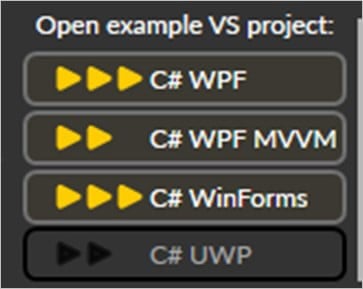
For trial SDK, we will be able to use the WPF and WinForms frameworks. If you are fully related to windows forms, this option will be more comfortable. In this case I will use the Windows Presentation Foundation framework.
After clicked the framework to use, we will need to specify a folder where the project will be created:
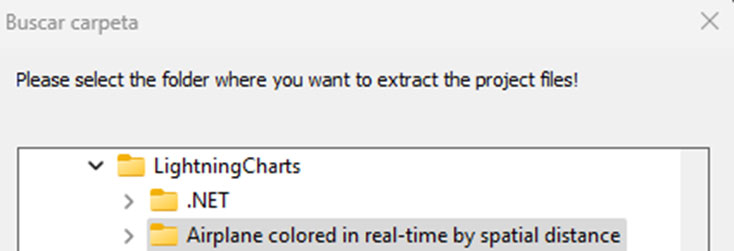
Finally, the project will be created, and the Visual Studio will be opened and ready for execution.
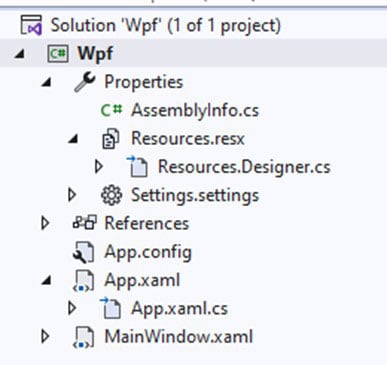
Code Review
The main code will be wrapped inside MainWindow.xaml.cs. Here we will find the code for UI controls.
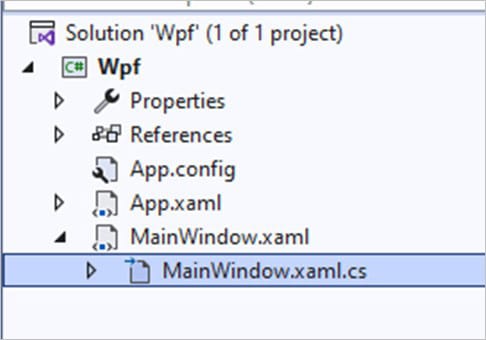
Inside the code we will check two methods that will create the properties that we need to draw correctly the chart.
CreateChart()
This main method will initialize many properties that are provided by the Lightning Chart .NET framework. The great advantage here is, if you have C# knowledge, this syntax will be easier for you.
_chart:
The chart object will contain the LightningChart constructor… basically, this will contain a new instance of a chart object.
_chart = new LightningChart();BeginUpdate:
Enabling this option suspends control repainting while modifying a property. It is advisable to use this when there are multiple property updates or when updating series points.
_chart.BeginUpdate();Specifying the type of chart:
Mesh chart = View3D
_chart.ActiveView = ActiveView.View3D;
... public enum ActiveView
{
	...ViewXY = 0,
	...View3D = 1,
	...ViewPolar = 2,
	...ViewSmith = 3,
	...ViewPie3D = 4,
}
Giving a name and background to the chart
Notice that here the chartGrid refers to the grid in the XAML.
_chart.ChartBackground.Color = Color.FromArgb(30, 30, 30, 30);
            _chart.Title.Text = "Airplane colored in real-time by spatial distance";

            chartGrid.Children.Add(_chart);
MeshModel Object
We are now creating the MeshModel object and adding the 3D airplane object. A Mesh model needs a 3D chart instance of the X, Y, and Z axes.
LoadFromFile will help to load the 3D object to the mesh. All the visual properties will be wrapped inside the 3D model.
MeshModel model = new MeshModel(scene3D, Axis3DBinding.Primary, Axis3DBinding.Primary, Axis3DBinding.Primary);
            model.LoadFromFile(Environment.CurrentDirectory + "\\Content\\A340-600_OBJ.obj");
Adding Size, Position, Rotation(degrees) to the model
The Model_GeometryConstructed helps create auxiliary data to facilitate the calculation of geometry and colors in real-time. This method helps to get the distance between all points on each axis.
model.Size.SetValues(sizeFactor, sizeFactor, sizeFactor);
            model.Position.SetValues(0, -15, 0);
            model.Rotation.SetValues(0, 0, 0);
            model.Fill = comboBoxFill.SelectedIndex < 2;
            model.Wireframe = comboBoxWireframe.SelectedIndex < 2;
            model.WireframeLineColor = DefaultColor;
            model.AllowUserInteraction = false;
            model.GeometryConstructed += model_GeometryConstructed;
            scene3D.MeshModels.Add(model);
Create data
The [MakeDataPoinst] function, will create an array of points. To assign data points to mesh, we need to use the SeriesPoint3D struct.
_points = MakeDataPoints();
            _pointCount = _points.Length;
            _dataPointValues = new double[_pointCount];
The values are double X, double Y, and double Z. For this example, the values are hardcoded, but if you need to assign values dynamically, the logic would be the same.
// Engines, inner.
new SeriesPoint3D(-11.6, -3.6, -8),
new SeriesPoint3D(11.6, -3.6, -8),

// Engines, outer.
new SeriesPoint3D(-24.8, -2.4, 0),
new SeriesPoint3D(24.8, -2.4, 0),

// Nose.
new SeriesPoint3D(0, 0, -44),

// Body.
new SeriesPoint3D(0, 0, -16),
new SeriesPoint3D(0, 0, 16),
new SeriesPoint3D(0, 5, 36),

// Wing tips.
new SeriesPoint3D(-36, 2.4, 12),
new SeriesPoint3D(36, 2.4, 12),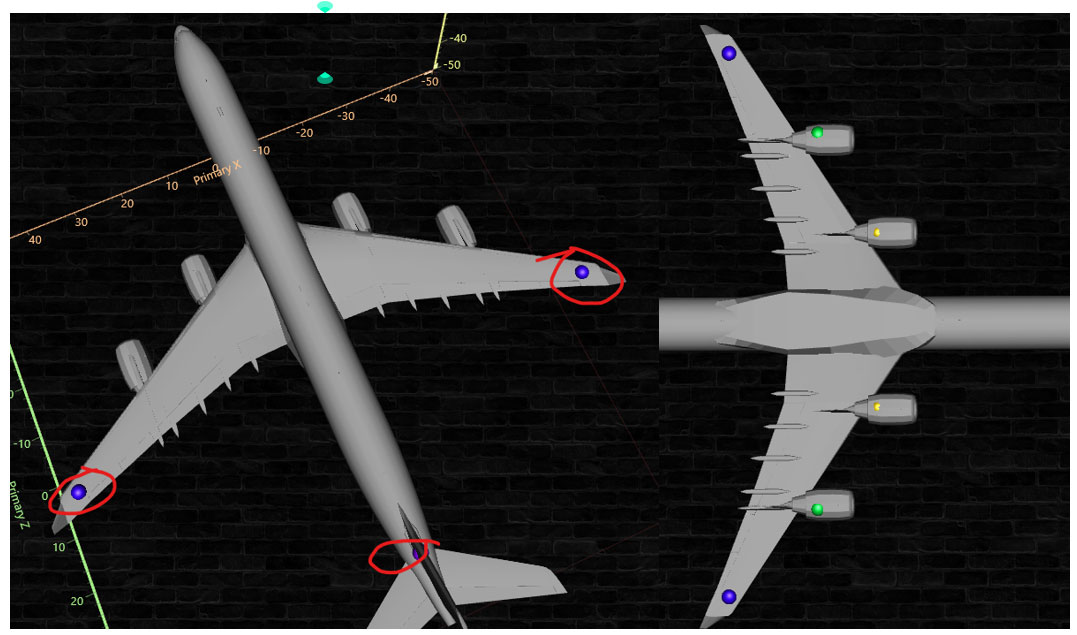
Legend color panel
Here we’ll create the additional side panel containing the color for code for the temperature reference on the aviation chart.
SurfaceGridSeries3D surface = new SurfaceGridSeries3D(scene3D, Axis3DBinding.Primary, Axis3DBinding.Primary, Axis3DBinding.Primary)
            {
                WireframeType = SurfaceWireframeType3D.None,
                ContourLineType = ContourLineType3D.None
            };
            surface.ContourPalette = CreatePalette(surface);
            surface.Title.Text = "Temperature";
            scene3D.SurfaceGridSeries3D.Add(surface);
We can create floating panels inside the current surface grid. Each panel can be a SurfaceGridSeries3D object, and it can be added to the parent grid. To create a range palette, we need to assign a ValueRangePalette object to the contourPalette property.
private ValueRangePalette CreatePalette(SurfaceSeries3DBase ownerSeries)
        {
            ValueRangePalette palette = new ValueRangePalette(ownerSeries);
            palette.Steps.Clear(); // Remove existing palette steps.
            for (int i = 0; i < _paletteStepCount; i++)
            {
                palette.Steps.Add(new PaletteStep(palette, _paletteStepColors[i], _paletteStepValues[i]));
            }
            palette.Type = PaletteType.Gradient;
            palette.MinValue = _paletteStepValues[0];

            return palette;
        }
Adding the data points to the chart
_dataPointSeries = new PointLineSeries3D(scene3D, Axis3DBinding.Primary, Axis3DBinding.Primary, Axis3DBinding.Primary)
            {
                Points = _points
            };
The data points were stored in the _points array object, so we need to create a new instance PointLinSeries3D to add it into the current scene3D:
scene3D.PointLineSeries3D.Add(_dataPointSeries);Before to add it, we can specify default UI properties to the points:
_dataPointSeries.PointStyle.Shape3D = PointShape3D.Sphere;
            _dataPointSeries.LineVisible = false;
            _dataPointSeries.IndividualPointColors = true;
            _dataPointSeries.AllowUserInteraction = true;
            _dataPointSeries.PointStyle.Size3D.SetValues(2, 2, 2);
            _dataPointSeries.Visible = (bool)checkBoxShowDataPoints.IsChecked;
            _dataPointSeries.Highlight = Highlight.None;
            _dataPointSeries.PointStyle.Shape2D.Shape = Shape.Circle;
            _dataPointSeries.PointStyle.Shape2D.GradientFill = GradientFillPoint.Solid;
            _dataPointSeries.PointStyle.Shape2D.Width = 11;
            _dataPointSeries.PointStyle.Shape2D.Height = 11;
_dataPointSeries.ShowInLegendBox = false;- Shape3D = Shape of the points (spheres in 3D view).
- IndividualPointColors = if it’s true, each point will have a different color.
- AllowUserInteraction = Interaction with the mouse.
- PointStyle.Size3D = Size of each point, width, height, depth.
EndUpdate()
Enables control repainting and refreshes the control.
Final Application
Here’s the final 3D Mesh model aviation chart:
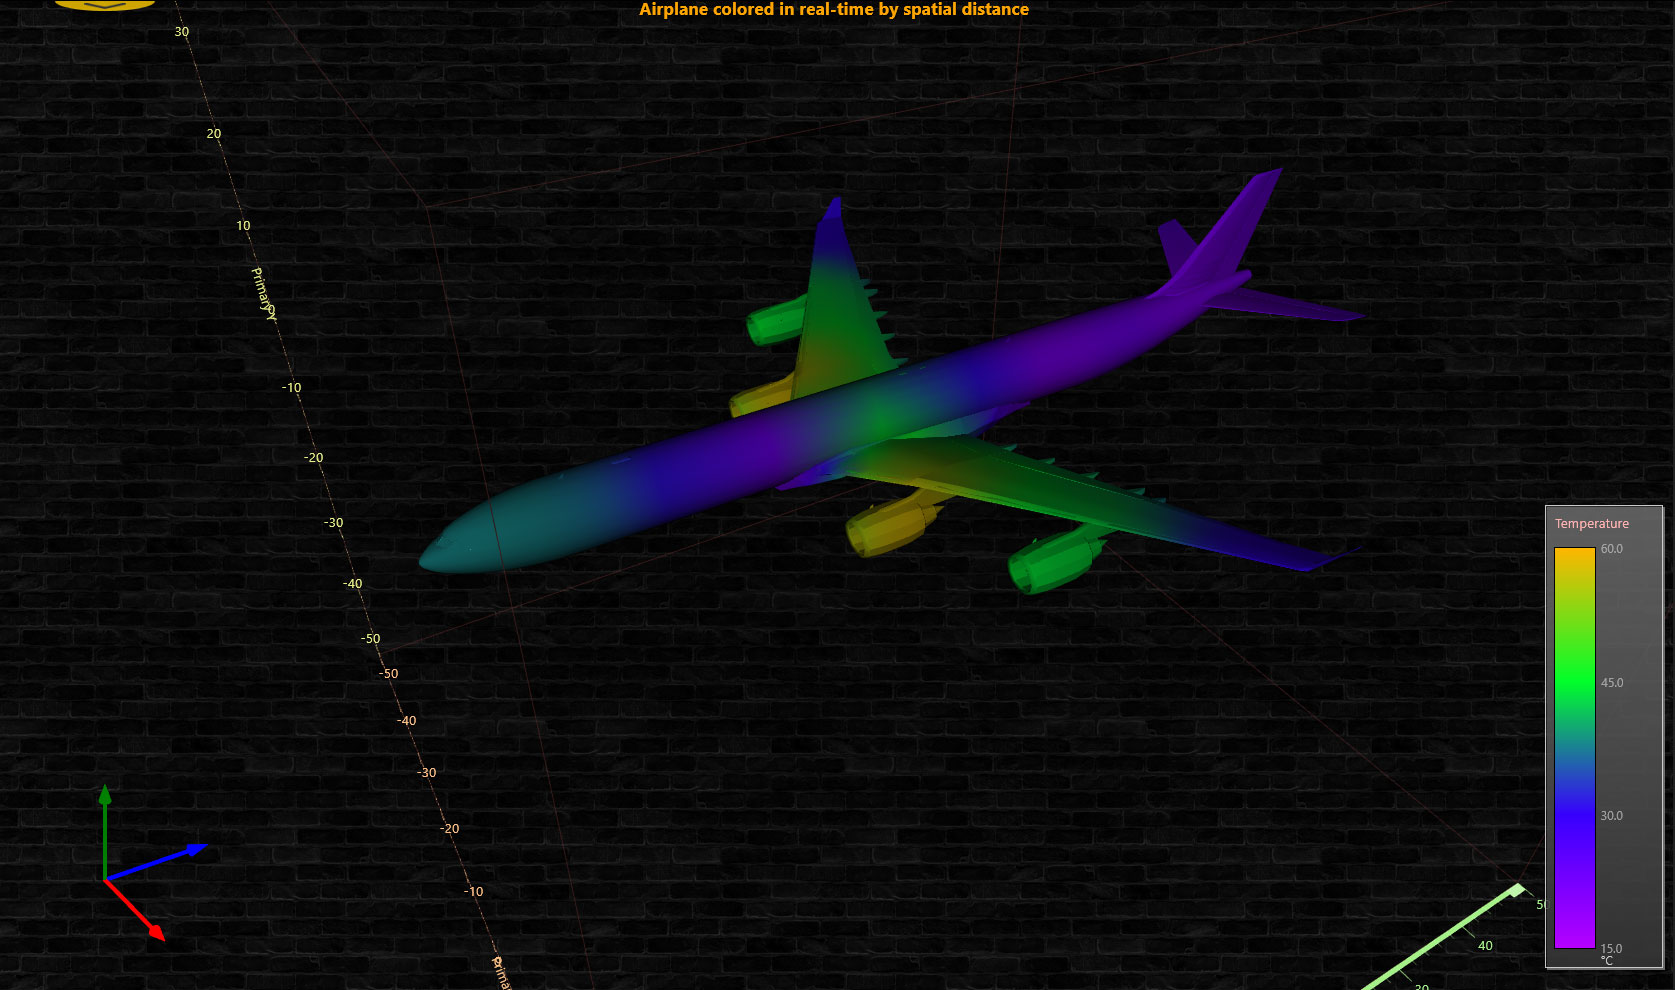
In conclusion, in this article, we’ve created a 3D mesh model real-time coloring application of an aircraft object. However, LightningChart .NET gives you all the freedom to incorporate your own 3D objects and customize their features. Feel free to incorporate this chart model into an aviation chart application or explore our .NET interactive examples and find other chart ideas.
See you in the next article.

