Here's a scenario that plays out across development teams every few months. Someone builds a React dashboard, picks...


Regional Account & Marketing Executive (China, Japan and South Korea)
+358 503 543 706
Book a meeting
Regional Account Manager (North America, South America)
+358 505 528 995
Book a meetingOur dedicated sales team is ready to help you find the perfect solution for your data visualization needs. Don't hesitate to reach out for personalized assistance or to schedule a demo of our products.

Regional Account & Marketing Executive (China, Japan and South Korea)
+358 503 543 706
Book a meetingRegional Account Manager (North America, South America)
+358 505 528 995
Book a meetingOur dedicated sales team is ready to help you find the perfect solution for your data visualization needs. Don't hesitate to reach out for personalized assistance or to schedule a demo of our products.


Here's a scenario that plays out across development teams every few months. Someone builds a React dashboard, picks...
Every year someone publishes a listicle of JavaScript charting libraries. They screenshot a demo, note the GitHub...
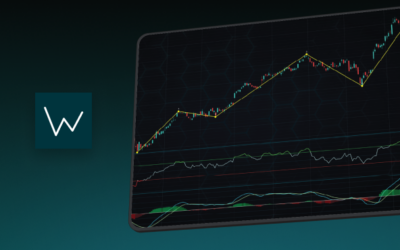
Ten Million Data Points in the Browser: How WebGL Makes Mass Datasets Interactive Ten million data points. That number...
Elliott Wave Theory in TradingFinancial markets often appear chaotic, but many traders believe that price movements...
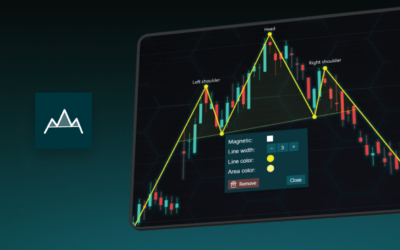
The Head and Shoulders Pattern in Technical Analysis The Head and Shoulders Pattern in Technical Analysis The Head and...

Telerik from Progress is a comprehensive UI component suite covering WPF, WinForms, ASP.NET, Blazor, and JavaScript....

Every WebSocket tutorial on the internet shows the same thing: a server sends a random number every second, a chart...

ScottPlot is genuinely excellent for what it is: a free, MIT-licensed, actively developed .NET plotting library with...
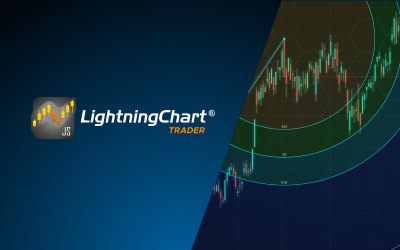
Using Fibonacci Tools in Trading: A Practical Guide for Market AnalysisTechnical traders rely on various tools to...
If you've been searching for a JavaScript charting library, you already know the problem: comparison articles tend to...

FusionCharts has been in enterprise JavaScript charting since the early 2000s and built a genuinely broad product, 90+...

DevExpress is one of the most comprehensive UI component suites in the .NET and web ecosystem. WinForms, WPF, ASP.NET,...