LightningChart JSCreate a 3D Mesh Model Application in JavaScript with LightningChart Chart
TutorialLearn more about 3D mesh objects used for creating data apps.
Published on March 11th, 2024 | Written by human
Introduction
Hi again, I’m Omar and in this article, we will create a 3D mesh model using the LightningChart JS library. Usually when we talk about 3D mesh models, we use using LC .NET library, but with the recent release of LightningChart JS v.5.1, 3D mesh models are now available.
A 3D mesh model is a three-dimensional shape made out of vertices, edges, and sides that define the form of an object. Now, it’s nice to know that we can start implementing this type of 3D mesh model charts in our Node JS and TypeScript projects.
Note that this type of application is useful (and widely used) in computer vision and graphics to create a structured and polygonal representation of a 3D object. In fact, these objects can be manipulated, animated, and rendered in various applications.
3D Mesh Models
A mesh model is generated based on the unions of coordinates located in a two-dimensional or three-dimensional plane. These planes with points have the appearance of a mesh, for that reason, the name mesh grid is used:
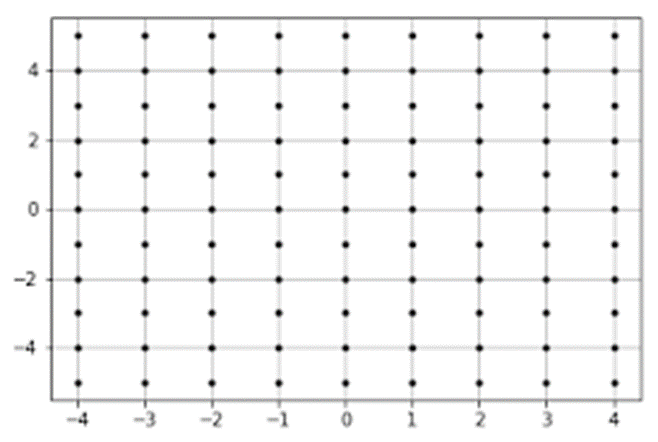
By having coordinates and joining the points, you can create the silhouette of the object of study, similar to a cartesian chart. In the case of three-dimensional meshes, we will have a more complex plane, with height, distance, and depth (X, Y, Z coordinates). In 3D objects, we can use vertices, limits, and faces to generate a complex object compared to a two-dimensional map.
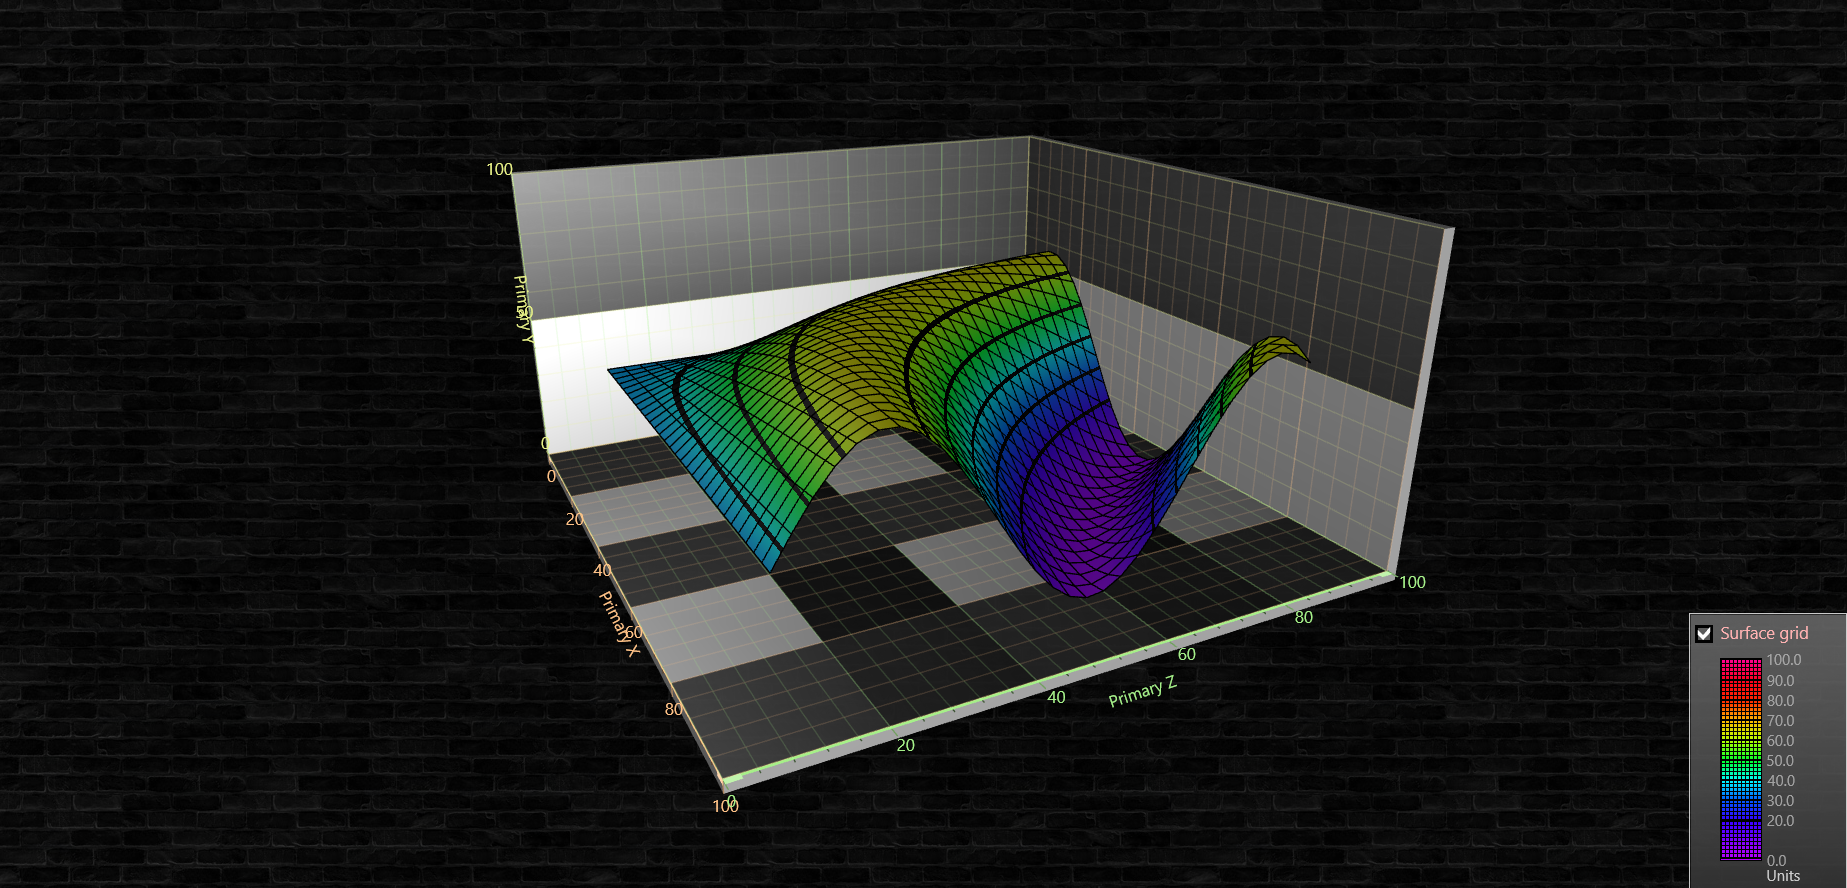
Example of a simple 3D surface grid.
It is worth mentioning that if a 3D object is more complex, it does not mean that it is better. Depending on the type of study, a two-dimensional object can offer a more direct and simple reading, while a 3D object helps to have a more interactive immersion in the object of study.
The use of mesh models in daily life
Whether as a developer, designer, or consumer, the use of this technology turns out to be more common than we think. Mesh models began as tools for scientific analysis (topographic studies, medicine, architecture, etc.) and access to them was not common. Currently, there are various 3D modeling systems, which can be used for the development of video games, animations, and graphic design.
As a consumer, it is quite common to interact with these objects simply by using a GPS map or playing video games. I suppose the importance of this topic is considerable, and I believe this chart can serve as an introduction to a tool that facilitates the development and logic behind it.

Example of a simple figure 3D mesh model.
Project Overview
In today’s exercise, we will create a 3D mesh model based on an airplane 3D object. The chart is part of LightningChart JS and showcases how to use custom coloring using the setVertexValues() method and the PalettedFill method.
Download the JavaScript 3D Mesh Model template
Template Setup
1. Download the template provided to follow the tutorial.
2. After downloading the template, you’ll see a file tree like this:
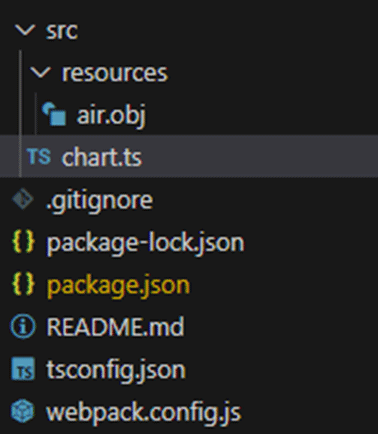
3. Open a new terminal and run the npm install command:
4. As usual in a NodeJS project, you need to run the npm install command. That would be everything for our initial setup. Let’s code.
Chart.ts
We will start by importing the necessary libraries to create our chart. In the project’s package.json file you can find the LightningChart dependencies:
1. Importing dependencies
"dependencies": {
    "@arction/lcjs": "^5.1.0",
    "@arction/xydata": "^1.4.0",
    "webgl-obj-loader": "^2.0.8"
  }
Today the most recent versions are LightningChart JS 5.1.0 and 1.4.0 (XYData). I recommend that you review the most recent versions and update them. This is because some LightningChart tools do not exist in previous versions. In the following routes you can find the most recent version of both libraries:
2. Extract required classes from lcjs
const lcjs = require('@arction/lcjs')
const obj = require('webgl-obj-loader')

const { lightningChart, PalettedFill, ColorRGBA, AxisTickStrategies, LUT, emptyFill, Themes } = lcjs
3. Import LCJS libraries into the chart.ts file
Once the LightningChart JS libraries are installed, we will import them into our chart.ts file. You will need a trial license and add it to a variable that will in turn be used in the constructor of the Chart3D object.
let license = undefined
try {
    license = 'xxx-xxxxx-xxx'
} catch (e) {}

const chart = lightningChart({license: license})
    .Chart3D({
        theme: Themes.cyberSpace,
    })
    .setBoundingBox({ x: 0.7, y: 0.5, z: 1 })
    .setTitle('Real-Time Airplane Temperature')
Theme refers to the collection of default implementations that you can access by using the Themes property. The Color theme of components must be specified when it is created, and can’t be changed afterwards (without destroying and recreating the component). All properties can be consulted in the Themes documentation.
SetBoundingBoxsets the dimensions of the Scenes bounding box. The bounding box is a visual reference that all the data of the Chart is depicted inside the Axes of the 3D chart are always positioned along the sides of the bounding box.
Building the 3D Mesh Model Chart
We will start by configuring the axes of our chart.
chart
    .getDefaultAxes()
    .forEach((axis) =>
        axis.setTickStrategy(AxisTickStrategies.Numeric, (ticks) =>
            ticks
                .setMajorTickStyle((major) => major.setLabelFillStyle(emptyFill))
                .setMinorTickStyle((minor) => minor.setLabelFillStyle(emptyFill)),
        ),
    )
The getDefaultAxes function allows us to access all the axes of the object. For each axis, we can apply the same properties, or if we need specific properties for each one, we can access each of them using Chart3D.getDefaultAxisX(), Chart3D.getDefaultAxisY(), Chart3D.getDefaultAxisZ().
The setTickStrategy function defines the positioning and formatting logic of Axis ticks as well as the style of created ticks. In this case, we use the numerical format for our axes. Within the styles collection, we can make use of time, time, and date or void. The setLabelFillStyle function allows us to assign a fill color to an object that supports that property. In this case, the emptyFill property returns a style without colors.
Coloring 3D Object
In this project, we will use an airplane as our 3D mesh model. This object is an .OBJ file downloaded from the LightningChart server. LightningChart JS does not include any routines for parsing 3D model files. To display your 3D models with LightningChart, you must export it to a triangulated file format (such as .OBJ), parse the data, and supply a list of vertices, indices, and optionally normal to LCJS. An .OBJ file is a geometry definition file format. This file can contain 3D objects and can be executed with editors such as Microsoft’s 3D viewer.
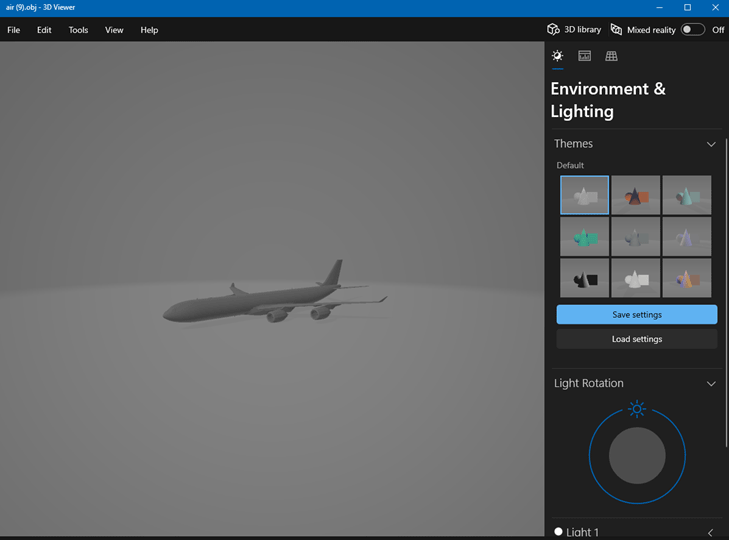
If you open the file with a text editor, you will see that it is made up of numerical values. These values correspond to the position of each vertex, the UV position of each texture coordinate vertex, vertex normals, and the faces that make each polygon defined as a list of vertices, and texture vertices. LC JS will oversee reading those values and generating the 3D mesh model object.
fetch('https://lightningchart.com/js-charts/interactive-examples/examples/assets/1502/air.obj')
    .then((response) => response.text())
    .then((data) => {
        const modelParsed = new obj.Mesh(data)
Once the 3d mesh model object is loaded, we will use its data for the coloring process.
const model = chart
            .addMeshModel()
            .setScale(0.0025)
            .setModelGeometry({ vertices: modelParsed.vertices, indices: modelParsed.indices, normals: modelParsed.vertexNormals })
            .setHighlightOnHover(false)
.setName('Airplane')addMeshModeladds the 3D object model to the chart. Learn more about addMeshModel.setScaleestablece la escala del objeto dentro del chart. Learn more about setScale.
setModelGeometry: Method for loading triangulated 3D model geometry data. The Mesh(data) function will help us to extract the values for vertices, indexes, normals, and vertex normals. In computer graphics geometry, a vertex normal at a vertex of a polyhedron represents a directional vector associated with that vertex. It serves as an approximation for the true geometric normal of the surface.
In geometry, a normal is an object (such as a line, ray, or vector) that stands perpendicular to a specified object. For instance, consider the normal line to a plane curve at a particular point; it is the line that forms a right angle with the tangent line to the curve at that point. In coordination chemistry and crystallography, the geometry index or structural parameter is a number ranging from 0 to 1 that indicates what the geometry of the coordination center is.
const palette = new PalettedFill({
            lookUpProperty: 'value',
            lut: new LUT({
                units: '°C',
                interpolate: true,
                steps: [
                    { value: 0, color: ColorRGBA(0, 150, 255) },
                    { value: 20, color: ColorRGBA(0, 255, 0) },

                    { value: 40, color: ColorRGBA(200, 255, 0) },
                    { value: 50, color: ColorRGBA(255, 255, 0) },
                    { value: 60, color: ColorRGBA(255, 200, 0) },

                    { value: 100, color: ColorRGBA(255, 130, 0) },
                    { value: 120, color: ColorRGBA(255, 0, 0) },
                ],
            }),
        })

        model.setFillStyle(palette)
Using a PalettedFill, each data point (or even pixel) can be colored individually. The basis of coloring can be configured extensively with a variety of different option combinations (read below for details)
Instances of PalettedFill, like all LCJS style classes, are immutable, meaning that its setters don’t modify the actual object, but instead return a completely new modified object.
Properties of PalettedFill:
- lut: color lookup table. Essentially a list of colors paired with numeric values.
- lookUpProperty: selects the basis of color lookup.
Configuring Vertices
Now we will assign values to the vertices (singular vertex).
// Skip first frame to avoid possible initial lag
        requestAnimationFrame(() => {
            // Initialize an empty array to store information about each vertex's relationship with sensors.
            const vertexCoordSensorWeights = []

            // Set vertex values using a callback function.
            model.setVertexValues((coordsWorld) => {
                const vertexValues = []
The requestAnimationFrame() method tells the browser that you want to perform an animation. Requests the browser to call a user-supplied callback function before the next repaint. The frequency of calls to the callback function will generally match the refresh rate of the screen. The most common refresh rate is 60Hz (60 cycles/frames per second), although 75Hz, 120Hz, and 144Hz are also widely used.
setVertexValues: Assign number values to each vertex of the model. This can be used for dynamic coloring of the model when paired with PalettedFill.
// Loop through the world coordinates of each vertex.
                for (let i = 0; i < coordsWorld.length; i += 1) {
                    // Convert the vertex's world coordinates into axis coordinates.
                    const locAxis = chart.translateCoordinate(coordsWorld[i], chart.coordsWorld, chart.coordsAxis)

                    // Create an array to store sensor weights.
                    const sensorWeights = new Array(sensors.length).fill(0)
                    let sumOfWeights = 0
Now we will assign the positions of each sensor on each axis. Each position corresponds to an area of the airplane, engine, nose, back, or body. In this way, we can assign colors that indicate higher temperatures in the engines and lower temperatures in the areas furthest from them. For this loop we will need to create an array that contains the values of each sensor:
const sensors = [
            // Engines close to the body
            { initValue: 90, value: 100, x: -0.252, y: -0.175, z: -0.25 },
            { initValue: 90, value: 100, x: 0.252, y: -0.175, z: -0.25 },

            // Engines far from the body
            { initValue: 110, value: 100, x: -0.52, y: -0.145, z: -0.07 },
            { initValue: 110, value: 100, x: 0.52, y: -0.145, z: -0.07 },

            // Nose of the plane
            { initValue: 20, value: 20, x: 0, y: -0.1, z: -1 },

            // Back of the plane
            { initValue: 50, value: 50, x: 0, y: -0.04, z: 0.97 },

            // Body ?
            { initValue: 20, value: 20, x: 0, y: -0.1, z: -0.5 },
            { initValue: 20, value: 20, x: 0, y: -0.1, z: 0 },
            { initValue: 0, value: 0, x: 0, y: -0.1, z: 0.5 },
        ]
The initial value increases about the accumulated temperature in each area of the airplane.
for (let i = 0; i < coordsWorld.length; i += 1) {
                    // Convert the vertex's world coordinates into axis coordinates.
                    const locAxis = chart.translateCoordinate(coordsWorld[i], chart.coordsWorld, chart.coordsAxis)

                    // Create an array to store sensor weights.
                    const sensorWeights = new Array(sensors.length).fill(0)
                    let sumOfWeights = 0

                    // Calculate distances and weights for each sensor.
                    sensors.forEach((sensor, i2) => {
                        const locationDeltaX = sensor.x - locAxis.x
                        const locationDeltaY = sensor.y - locAxis.y
                        const locationDeltaZ = sensor.z - locAxis.z
                        const dist = Math.sqrt(locationDeltaX ** 2 + locationDeltaY ** 2 + locationDeltaZ ** 2)
                        const weight = dist !== 0 ? 1 / dist ** 3 : 1
                        sensorWeights[i2] = weight
                        sumOfWeights += weight
                    })

                    // Store sum of weights and sensor weights for each vertex.
                    vertexCoordSensorWeights.push({ sumOfWeights, sensorWeights })

                    // Calculate vertex value based on sensor values and weights.
                    const vertexValue = sensors.reduce((prev, cur, i2) => prev + cur.value * sensorWeights[i2], 0) / sumOfWeights || 20

                    // Push the vertex value to the array.
                    vertexValues.push(vertexValue)
                }
For each vertex, we will assign the values of each sensor. The translateCoordinate function will help us convert the coordinates into pixels relative to the bottom left corner of the chart.
Conclusion
In this article, we reviewed some theories about 3D mesh models. With the most recent update of LCJS, we can generate charts with 3D objects, as well as extract geometric values and manipulate them as necessary. It should be noted that LC JS cannot read 3D modeling files, and it will be necessary to use OBJ files to analyze the data.
Generating an OBJ file will not be a big problem, since there are currently editors that allow you to generate them from the design of the object. Coloring or the use of palettes allows us to generate effects on our 3D object, such as in this case, temperature degrees by areas of the airplane. This type of 3D mesh model chart will be a great tool for telemetry dashboards. If you need a version of the .NET, you can visit our articles on WPF 3D mesh models with the LC .NET library.
Thanks for your attention, bye!
Introduction to Area Graphs
Introduction to Area GraphsArea graphs are a chart type for visualizing data which provides a clear and intuitive representation of data trends and patterns over time or across categories. By utilizing shaded areas, area graphs effectively display the magnitude and...
SQL and LightningChart JS dashboard
Published on April 18th, 2024 | Written by humanSQL Dashboard ApplicationHello! In today's article, we will see work on a small project using several development tools. We will create an SQL Dashboard with data generated in SQL Server and use Angular for web...
JavaScript 2D Bubble Chart
JavaScript 2D Bubble ChartIn this article, we will create a JavaScript 2D bubble chart using Node JS and LightningChart JS. Remember that you can download the template and use it to experiment with it. When we are looking for an attractive way to represent our data,...

