LightningChart .NETWPF Temperature Monitoring Application
TutorialCreate a real-time temperature monitoring application with LightningChart .NET
Written by human on February 19th, 2024
Temperature sensor applications
Real-time temperature monitoring applications are an essential tool for engineers and developers in industrial sectors. Temperature monitoring applications use temperature sensors, thermal sensors, and telemetry to record and transmit real-time data from different machinery for processing.
With cutting-edge technologies, creating a real-time temperature monitoring application has become more accessible and efficient than ever before, especially when using high-performance charting libraries.
In this article, we will be using LightningChart .NET chart components, specifically the Realtime, ViewXY, and LiteLineSeries to create a high-performance real-time temperature monitoring application.
The advantage of temperature monitoring applications is providing a comprehensive understanding of temperature data fluctuations, allowing end-users to take proactive measures and prevent potential risks in machinery. This tutorial explores the process of developing a real-time temperature monitoring application in WPF.
Project Video Demo
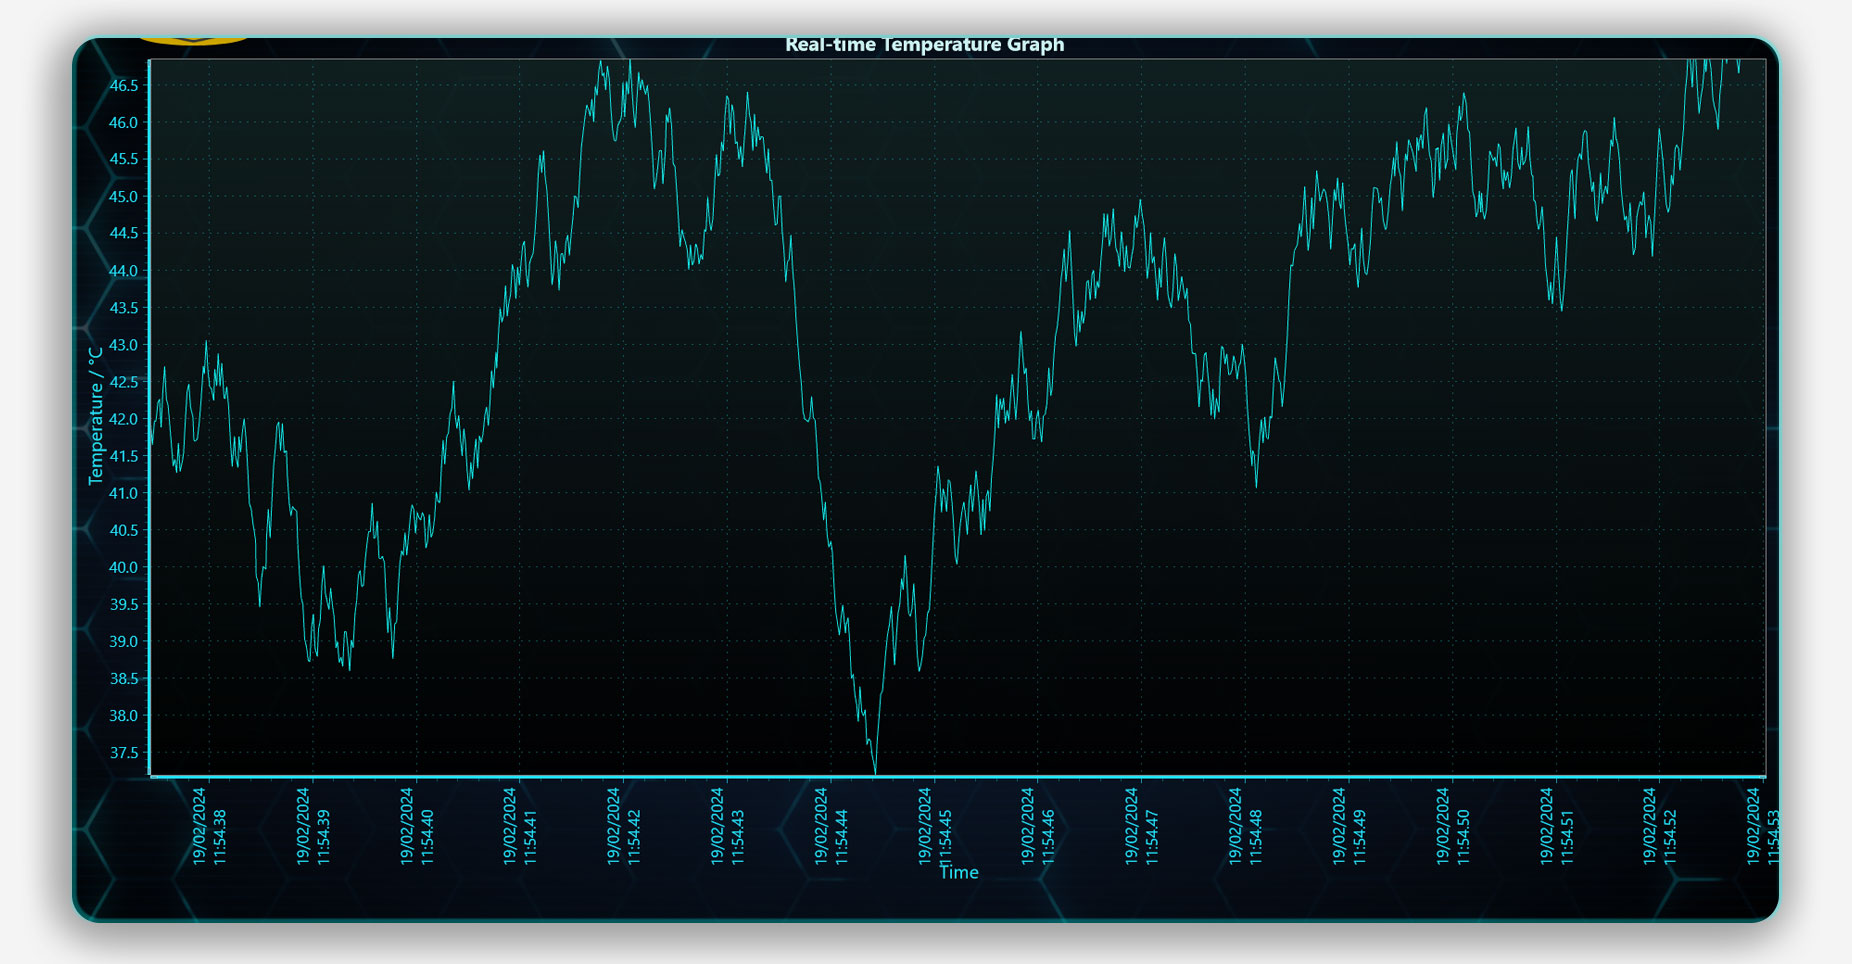
The temperature sensor application is a simple yet powerful scrolling real-time temperature monitor graph with a date and time axis. The chart application will be created using the WPF template found in the Interactive Examples app from LightningChart .NET.
Download the project to follow the tutorial
Local Setup
For this project, we need to consider the following requirements to compile the project.
- OS: 32-bit or 64-bit Windows Vista or later, Windows Server 2008 R2 or later.
- DirectX: 9.0c (Shader model 3 and higher) or 11.0 compatible graphics adapter.
- Visual Studio: 2010-2019 for development, not required for deployment.
- Platform .NET Framework: installed version 4.0 or newer.
Now go to the next URL and download LightningChart .NET. You’ll then be redirected to a sign-in form where you’ll have to complete a simple sign-up process to get access to your LightningChart account.
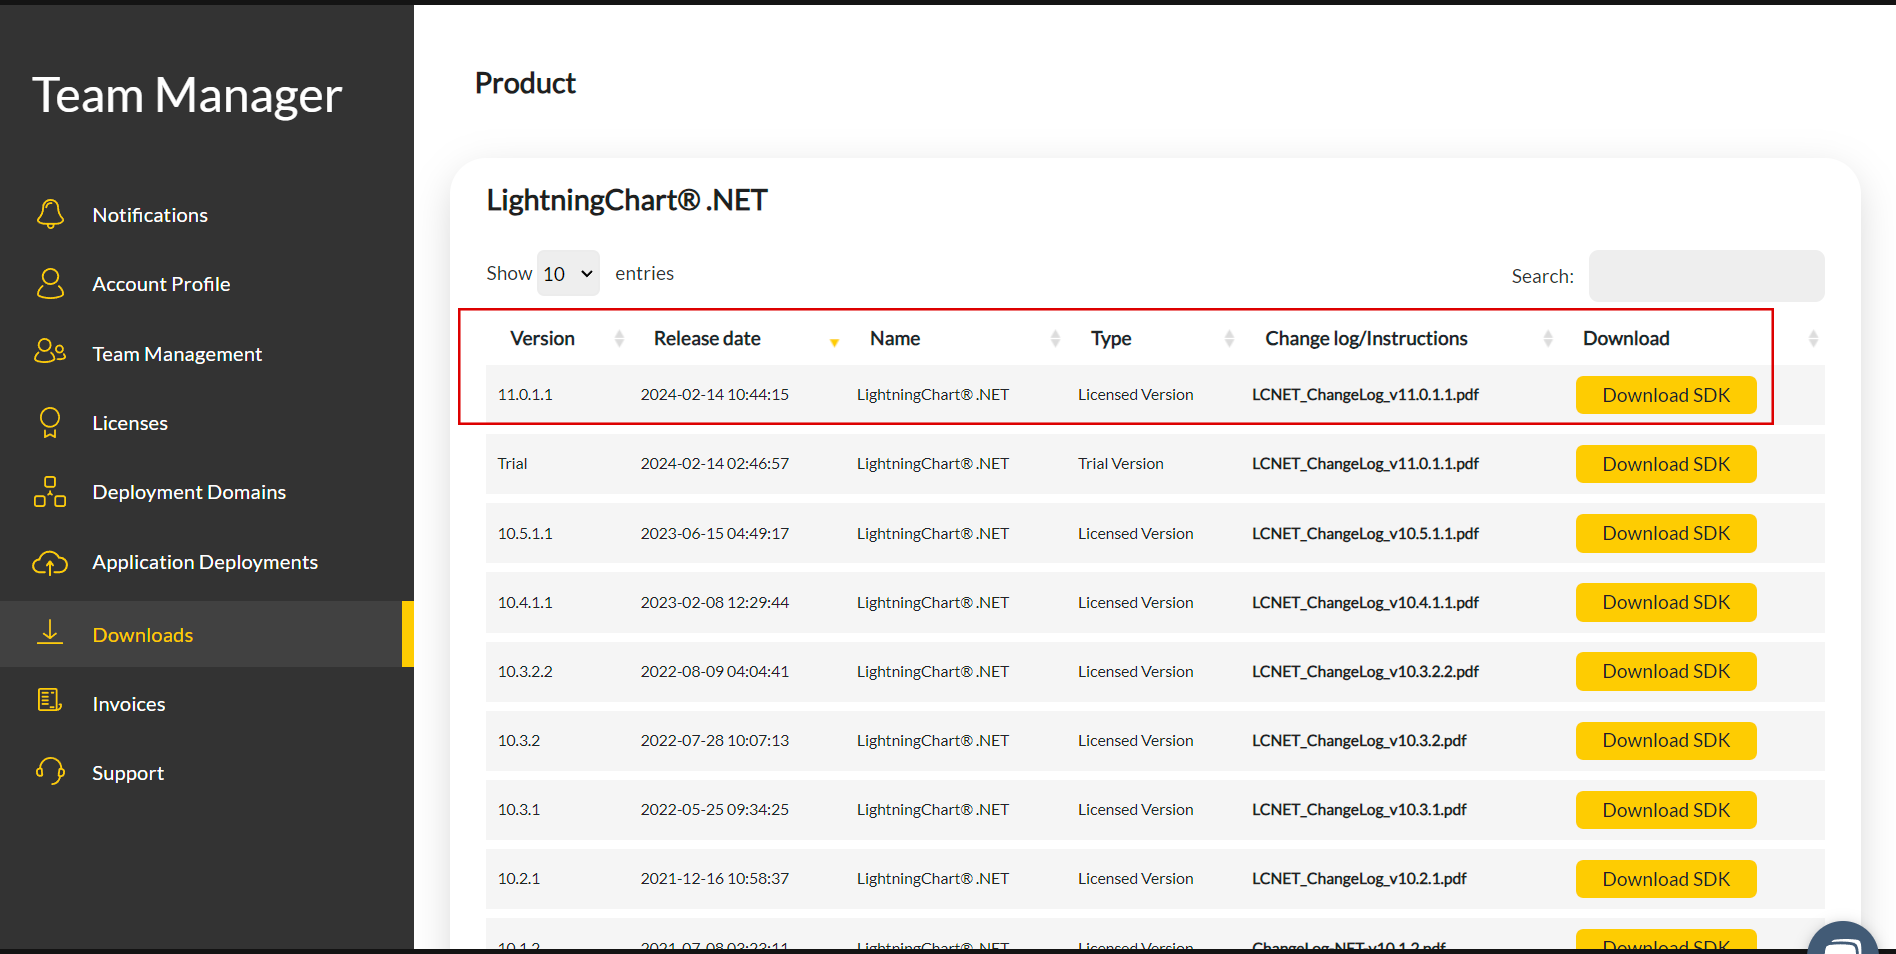
After signing in to your account, you can download the SDK “free trial” version that allows you to use important features for this tutorial. When you download the SDK, you’ll have a .exe file like this:

The installation will be a typical Windows process, so please continue with it until it is finished. After the installation, you will see the following programs:

License Manager
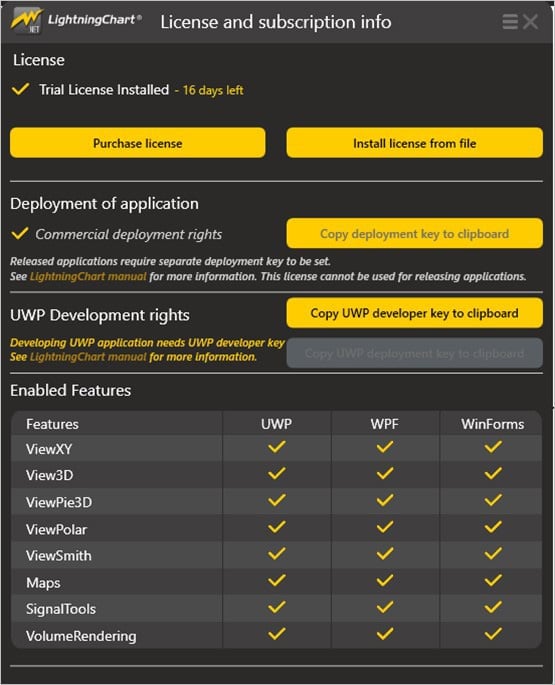
In this application, you will see the purchase options. All the projects that you will create with this trial SDK, will be available for future developments with all features enabled.
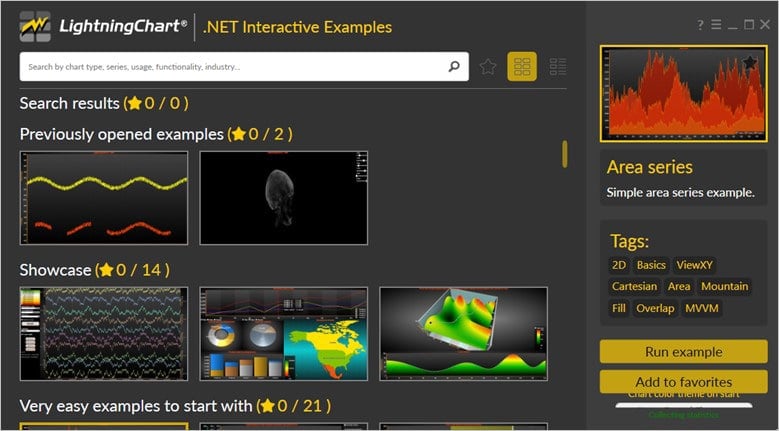
LightningChart .NET Interactive Examples
You can see 100+ interactive visualizations for WPF, WinForms, and/or UWP.
Visual Studio Project
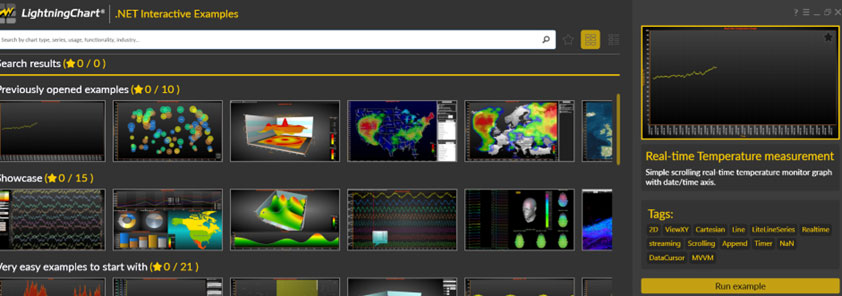
The main difference between the LightningChart visualizer and Visual Studio is that we can analyze and experiment with many features within the source code. In the LC visualizer, select the “Real-Time Temperature Measurement” example and run it:
In the top-right zone of the windows, you will see the following options:
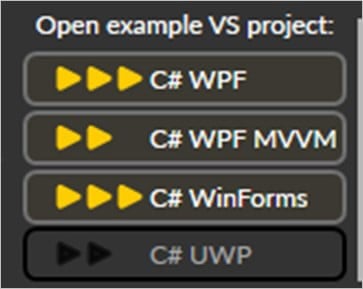
The SDK trial allows us to use the WPF framework. After selecting the right framework, we need to specify a folder where to create the project:
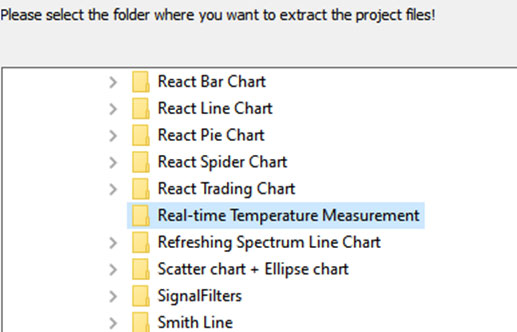
After creating the project, Visual Studio will open and be ready for execution.
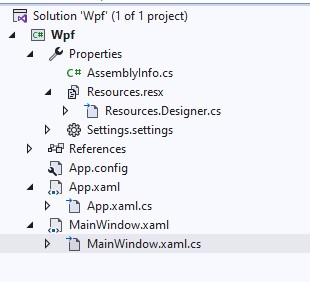
XAML Code Review
The main XAML code will be wrapped inside MainWindow.xaml.cs and contains the code of the temperature monitoring application.
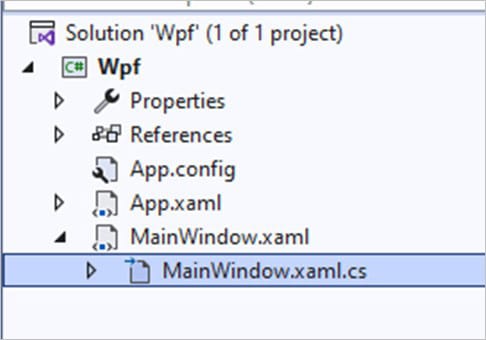
Inside the code, we will check two methods for creating the properties needed to draw the chart correctly. The interactive temperature monitoring application example is built with various user controls to manipulate and change the visual properties of the chart. These controls are not required to generate this graph, so we will focus on the code responsible for generating the object.
CreateChart(): real-time temperature monitoring application
_previousTemperature = 50.0;
_previoustX = 0.0;
_rand = new Random((int)DateTime.Now.Ticks);

InitializeComponent();
CreateChart();
We will start with the InitializeComponent method to load our XAML template and access its objects. We declare some variables that we will use later to calculate the temperature values.
InitializeComponent();
CreateChart();
To display the temperature monitoring application chart in an XAML frame, the CreateChart method will build the chart object. We must create a LightningChart object using this constructor to specify the chart type and access various properties.
_chart = new LightningChart();

_chart.BeginUpdate();
The BeginUpdate() function will allow us to stop drawing the chart, which will allow us to set up the properties that we want to customize. As long as the update is not closed, the chart will not show the changes we make, this will help with the performance of the chart construction. We need to specify what type of chart we want to use. In this case, we need the XY chart. The XY chart is a two-dimensional chart. There are several types of views:
- XY
- 3D
- Pie3D
- Polar
- Smith
Axis Configuration
We need to add properties to our X-Y axes, part of that we will use the AxisX and AxisY classes. We can add tags, and executor behaviors, among other configurations.
AxisX xAxis = _chart.ViewXY.XAxes[0];
xAxis.ValueType = AxisValueType.DateTime;
xAxis.ScrollMode = XAxisScrollMode.Scrolling;
xAxis.Title.Text = "Time";
xAxis.AutoFormatLabels = false;
xAxis.LabelsTimeFormat = "dd/MM/yyyy\nHH:mm.ss";
xAxis.LabelsAngle = 90;
Scrolling:
The X axis is kept stationary until the scrolling gap has been reached, after which the X axis with all series is continuously shifted left. If the scrolling should take effect when the scroll position reaches the end of the X axis, set ScrollingGap to 0.
Value Type:
DateTime refers to the date presentation, with the optional time of day. When the AutoFormatLabels is disabled, LabelsTimeFormat applies here as well, similarly to the Time type. For best accuracy, it is advised to set DateOriginYear, DateOriginMonth, and DateOriginDay just below the dates shown in the chart. Use DateTimeToAxisValue the method to obtain axis values from a .NET DateTime object to be used in series data:
DateTime now = DateTime.Now;
double minX = xAxis.DateTimeToAxisValue(now);
double maxX = xAxis.DateTimeToAxisValue(now) + 30;
xAxis.SetRange(minX, maxX);
Set the value range by giving values to Minimum and Maximum properties, the minimum must be less than the Maximum. When trying to set Minimum > Maximum, or vice versa, the internal limiter will limit the values near the other value. To set both values simultaneously, use the SetRange method. Passing Minimum > Maximum in SetRange automatically flips these values so that Minimum < Maximum.
AxisY yAxis = _chart.ViewXY.YAxes[0];
yAxis.Title.Text = "Temperature / °C";
yAxis.SetRange(0, 100);
Line Series Configuration
Now we need to create our data series. The LiteLineSeries can only be used with a linear axis and DirectX11 motor. These series will be examples within the chart and their values can be modified. LineSeries can be of different types, but in this case, we will use the line style. LineSeries uses arrays of data points with the values of the X-Y axes.
LiteLineSeries series = new LiteLineSeries(_chart.ViewXY, xAxis, yAxis);
series.Color = Colors.Yellow;
series.AllowUserInteraction = false;
_chart.ViewXY.LiteLineSeries.Add(series);
Finishing Chart Configuration
We hide the legend box of the temperature monitoring application chart, reactivate the repainting of the chart, and add the chart to the XML grid. The start method will begin the process of generating data points and updating the line series.
//Hide legend box
_chart.ViewXY.LegendBoxes[0].Visible = false;

//Allow chart rendering
_chart.EndUpdate();

(Content as Grid).Children.Add(_chart);


Start();
AddTemperature(): temperature sensor
This method will create data points that will be added to our series lines (a real temperature sensor can help you transmit real-time data). This method will stop the repainting of the temperature monitoring system chart, and once the process is finished, the repainting will be activated, showing the new lines with values.
//Disable updates, to prevent several extra refreshes
_chart.BeginUpdate();

// An array for 1 point.
double[,] points = new double[1,2];
//Convert 'Now' to X value
_previoustX = _chart.ViewXY.XAxes[0].DateTimeToAxisValue(DateTime.Now);

//Store X and Y values
points[0,0] = _previoustX;
points[0,1] = CalculateYValue();

//Add the new point into end of first PointLineSeries
_chart.ViewXY.LiteLineSeries[0].AddPoints(points, false);

//Set real-time monitoring scroll position, to latest X point.
//ScrollPosition indicates the position where monitoring is currently progressing.
_chart.ViewXY.XAxes[0].ScrollPosition = _previoustX;

//Allow updates again, and update
_chart.EndUpdate();
Conclusion
We are done with this temperature monitoring application example that was fairly simple but a very useful remote temperature monitoring system. What are the applications of temperature sensors? Mainly, some applications are industrial type and are used for processing telemetry data.
You can try to obtain your data from a real telemetry sensor which can help you feed other temperature sensor applications. So, you can get creative and use this template to create other monitoring systems.
Remember that you only need an array of data points and add them to the series lines. You can obtain these values from a database or a CSV. The process is quite simple, we must choose the type of chart we need, in this case, it was one of the XY types.
Next, we need to configure the behavior and display of our two axes. Finally, create the series of lines that we will need and assign values to them. Remember that before visually modifying a temperature monitoring system chart, we must stop the repainting with the BeginUpdate() method and when finished, reactivate our chart with the new properties using EndUpdate().
Thank you for coming this far and I’ll wait for you in our next article, thank you. Bye!
