Published on March 11th, 2024 | Written by humanIntroductionHi again, I'm Omar and in this article, we will create a...
Published on March 11th, 2024 | Written by humanIntroductionHi again, I'm Omar and in this article, we will create a...

JavaScript 3D Bubble ChartHello, I'm Omar and we'll start with a quick JavaScript charting exercise. We will create a...
Written by human | Updated on February 23rd, 2024Volume Rendering: VolumeModelsVolumeModels is a tool for volume data...

What is Cardiac Telemetry?Cardiac telemetry is a method used in healthcare to continuously monitor and track the...
Intro to WPF World Population 3D MapsThe purpose of this tutorial is to walk you through how to create a WPF word...
About Environmental MapsHello! Continuing with this series of world maps, today we will create an XY two-dimensional...
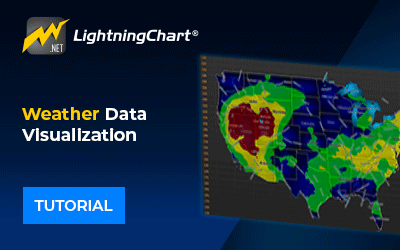
Introduction to Weather Data VisualizationsWeather data visualization is useful when trying to understand complex...
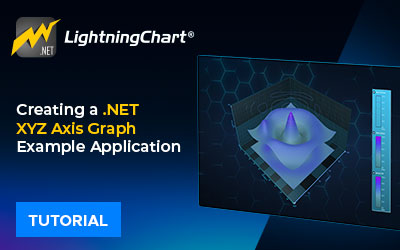
What is an XYZ axis graph?An XYZ-axis graph allows you to plot points, lines, and surfaces in three dimensions. These...
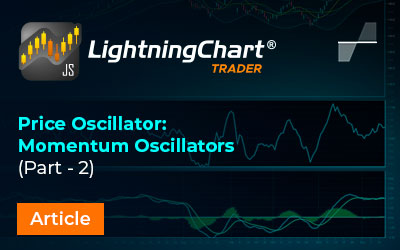
Price Oscillators Part 2: Momentum OscillatorsIn the first part of the Price Oscillator series, we examined the...
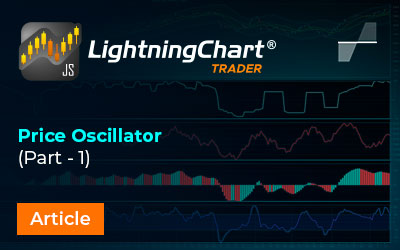
Price OscillatorsPrice oscillators use two moving averages to calculate the difference between the two data points....
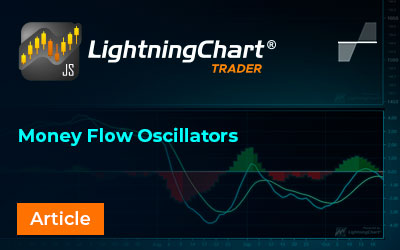
Money Flow OscillatorsThis is the third part of the series on technical indicators for market analysis (trends,...
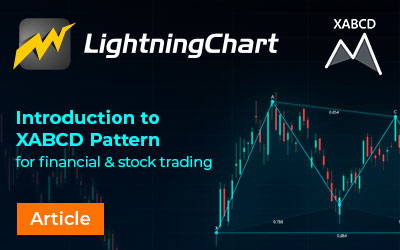
Introduction to XABCD Pattern (Harmonic Pattern)XABCD Pattern, also known as Harmonic Pattern, is a trading drawing...