


Blog
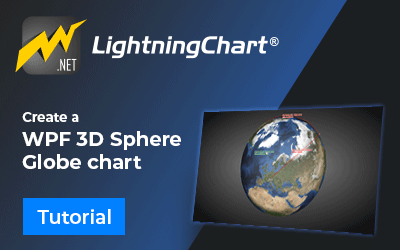
WPF 3D Sphere
Written by a human | Updated on April 23rd, 2025WPF 3D SphereIn this article, we will create a WPF 3D sphere globe chart using the Lightning Chart .NET library. As we know, a WPF 3D globe chart is a 3D sphere representing the Earth that shows the Earth's surface and three-dimensional model. One of the main objectives of these sphere models is to...
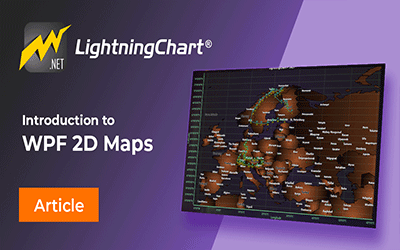
WPF 2D Maps
Written by a human | Updated on April 23rd, 2025Introduction to WPF 2D MapsIn this article, we’ll talk about WPF 2D maps in geospatial data visualization and the tools the LightningChart .NET library offers us to generate this type of chart. What does Geospatial mean? This word refers to geospatial analysis focused on the collection,...
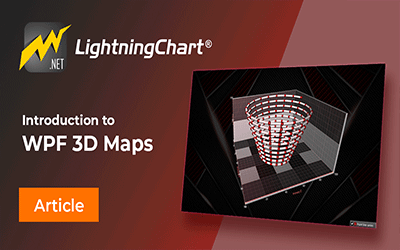
WPF 3D Maps
Written by a human | Updated on April 23rd, 2025WPF 3D MapsHello! In this article, we will focus on the theory behind WPF 3D maps. It will also serve as an introduction to creating this type of chart using the Lightning Chart .NET tools. If you have seen our previous articles, you will know that LightningChart has an Interactive Examples demo...
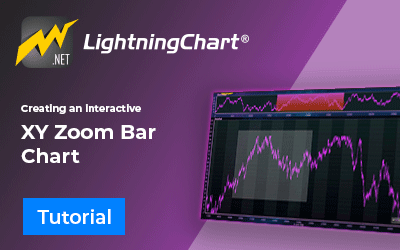
XY Zoom Bar Chart
XY Zoom Bar ChartToday we will continue working with XY charts, but now we will have two charts within the same project. A chart will traditionally display a signal while the other chart will serve as an analysis tool showing us the area of the signal we are studying. This will allow us to select an area we want on the main chart. This chart aims...

Cardiac Telemetry
Written by a human | Updated on April 23rd, 2025What is Cardiac Telemetry?Cardiac telemetry is a method used in healthcare to continuously monitor and track the health parameters of individuals diagnosed with heart conditions or those recovering from heart-related ailments. This monitoring technique allows healthcare providers to observe heart...
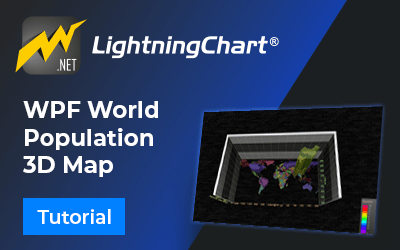
WPF World Population 3D Map
Written by a human | Updated on April 23rd, 2025Intro to WPF World Population 3D MapsThe purpose of this tutorial is to walk you through how to create a WPF word population 3D map using the 3D surface series and coordinate calculation tools. The population levels will be represented with polygons of different heights, to show the magnitude of...
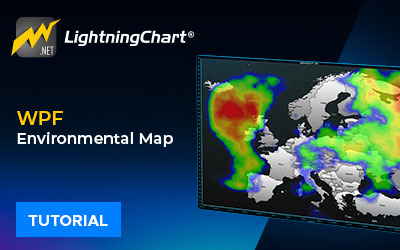
Environmental Map
Written by a human | Updated on April 23rd, 2025About Environmental MapsHello! Continuing with this series of world maps, today we will create an XY two-dimensional map, on which we will simulate environmental conditions. These types of maps show climate conditions and changes over a region of the world. It is very common to see them on news...
Weather Data Visualization
Written by a human | Updated on April 22nd, 2025Introduction to Weather Data VisualizationsWeather data visualization is useful when trying to understand complex weather patterns and climate trends. Weather data visualization helps us visualize the weather in specific regions, for instance, in this tutorial, we will create a weather data...
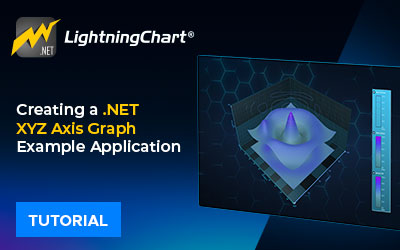
XYZ Axis Graph
Written by a human | Updated on April 15th, 2025What is an XYZ axis graph?An XYZ-axis graph allows you to plot points, lines, and surfaces in three dimensions. These dimensions are identified as axes, and data points are positioned anywhere along these XYZ axes: The X-axis: Typically runs horizontally. Y-axis: Usually, vertical. Z-axis: works of...
Price Momentum Oscillator
Written by a human | Updated on April 22nd, 2025Price Oscillators Part 2: Momentum OscillatorsIn the first part of the Price Oscillator series, we examined the evolution of indicators and the dynamics of money flow oscillators. This second part delves into the problems of moving averages. Money flow oscillators aim to identify market trends by...


If you have any questions, feel free to contact us!
©LightningChart Ltd 2026. All rights reserved.