









Elliott Wave Theory in Trading
Financial markets often appear chaotic, but many traders believe that price movements follow recurring patterns driven by human psychology. One of the most influential approaches based on this idea is the Elliott Wave Theory. Developed nearly a century ago, it remains one of the most widely studied methods of technical analysis.
In this article, we’ll explore what Elliott Wave Theory is, how it works, the benefits of using it as well as its disadvantages, and finally how traders can incorporate it into modern trading strategies. We also take a look at how to use Elliot Wave in one of the technical analysis platforms available, LightningChart JS Trader.
What Is Elliott Wave Theory?
Elliott Wave Theory was developed by Ralph Nelson Elliott in the 1930s. After studying decades of stock market data, Elliott observed that markets move in repetitive wave-like structures reflecting the collective emotions of investors.
The theory suggests that markets alternate between Impulse waves, which move in the direction of the primary trend, and Corrective waves, which move against the trend.
According to Elliott, these patterns repeat across all timeframes from one-minute charts to multi-year market cycles, making the market fractal in nature.
The Wave Structure
The foundation of Elliott Wave Theory consists of an 8-wave cycle. First, the trend advances through five impulse waves, after which the market typically enters a three-wave correction.
Impulse Phase
- Wave 1: The initial move in the new trend.
- Wave 2: A pullback that retraces part of Wave 1.
- Wave 3: Usually the strongest and longest wave as more traders recognize the trend.
- Wave 4: Another correction with generally less retracement than Wave 2.
- Wave 5: The final push before the trend becomes exhausted.
Corrective Phase
- Wave A: Initial move against the trend.
- Wave B: Temporary recovery.
- Wave C: Final correction completing the cycle.
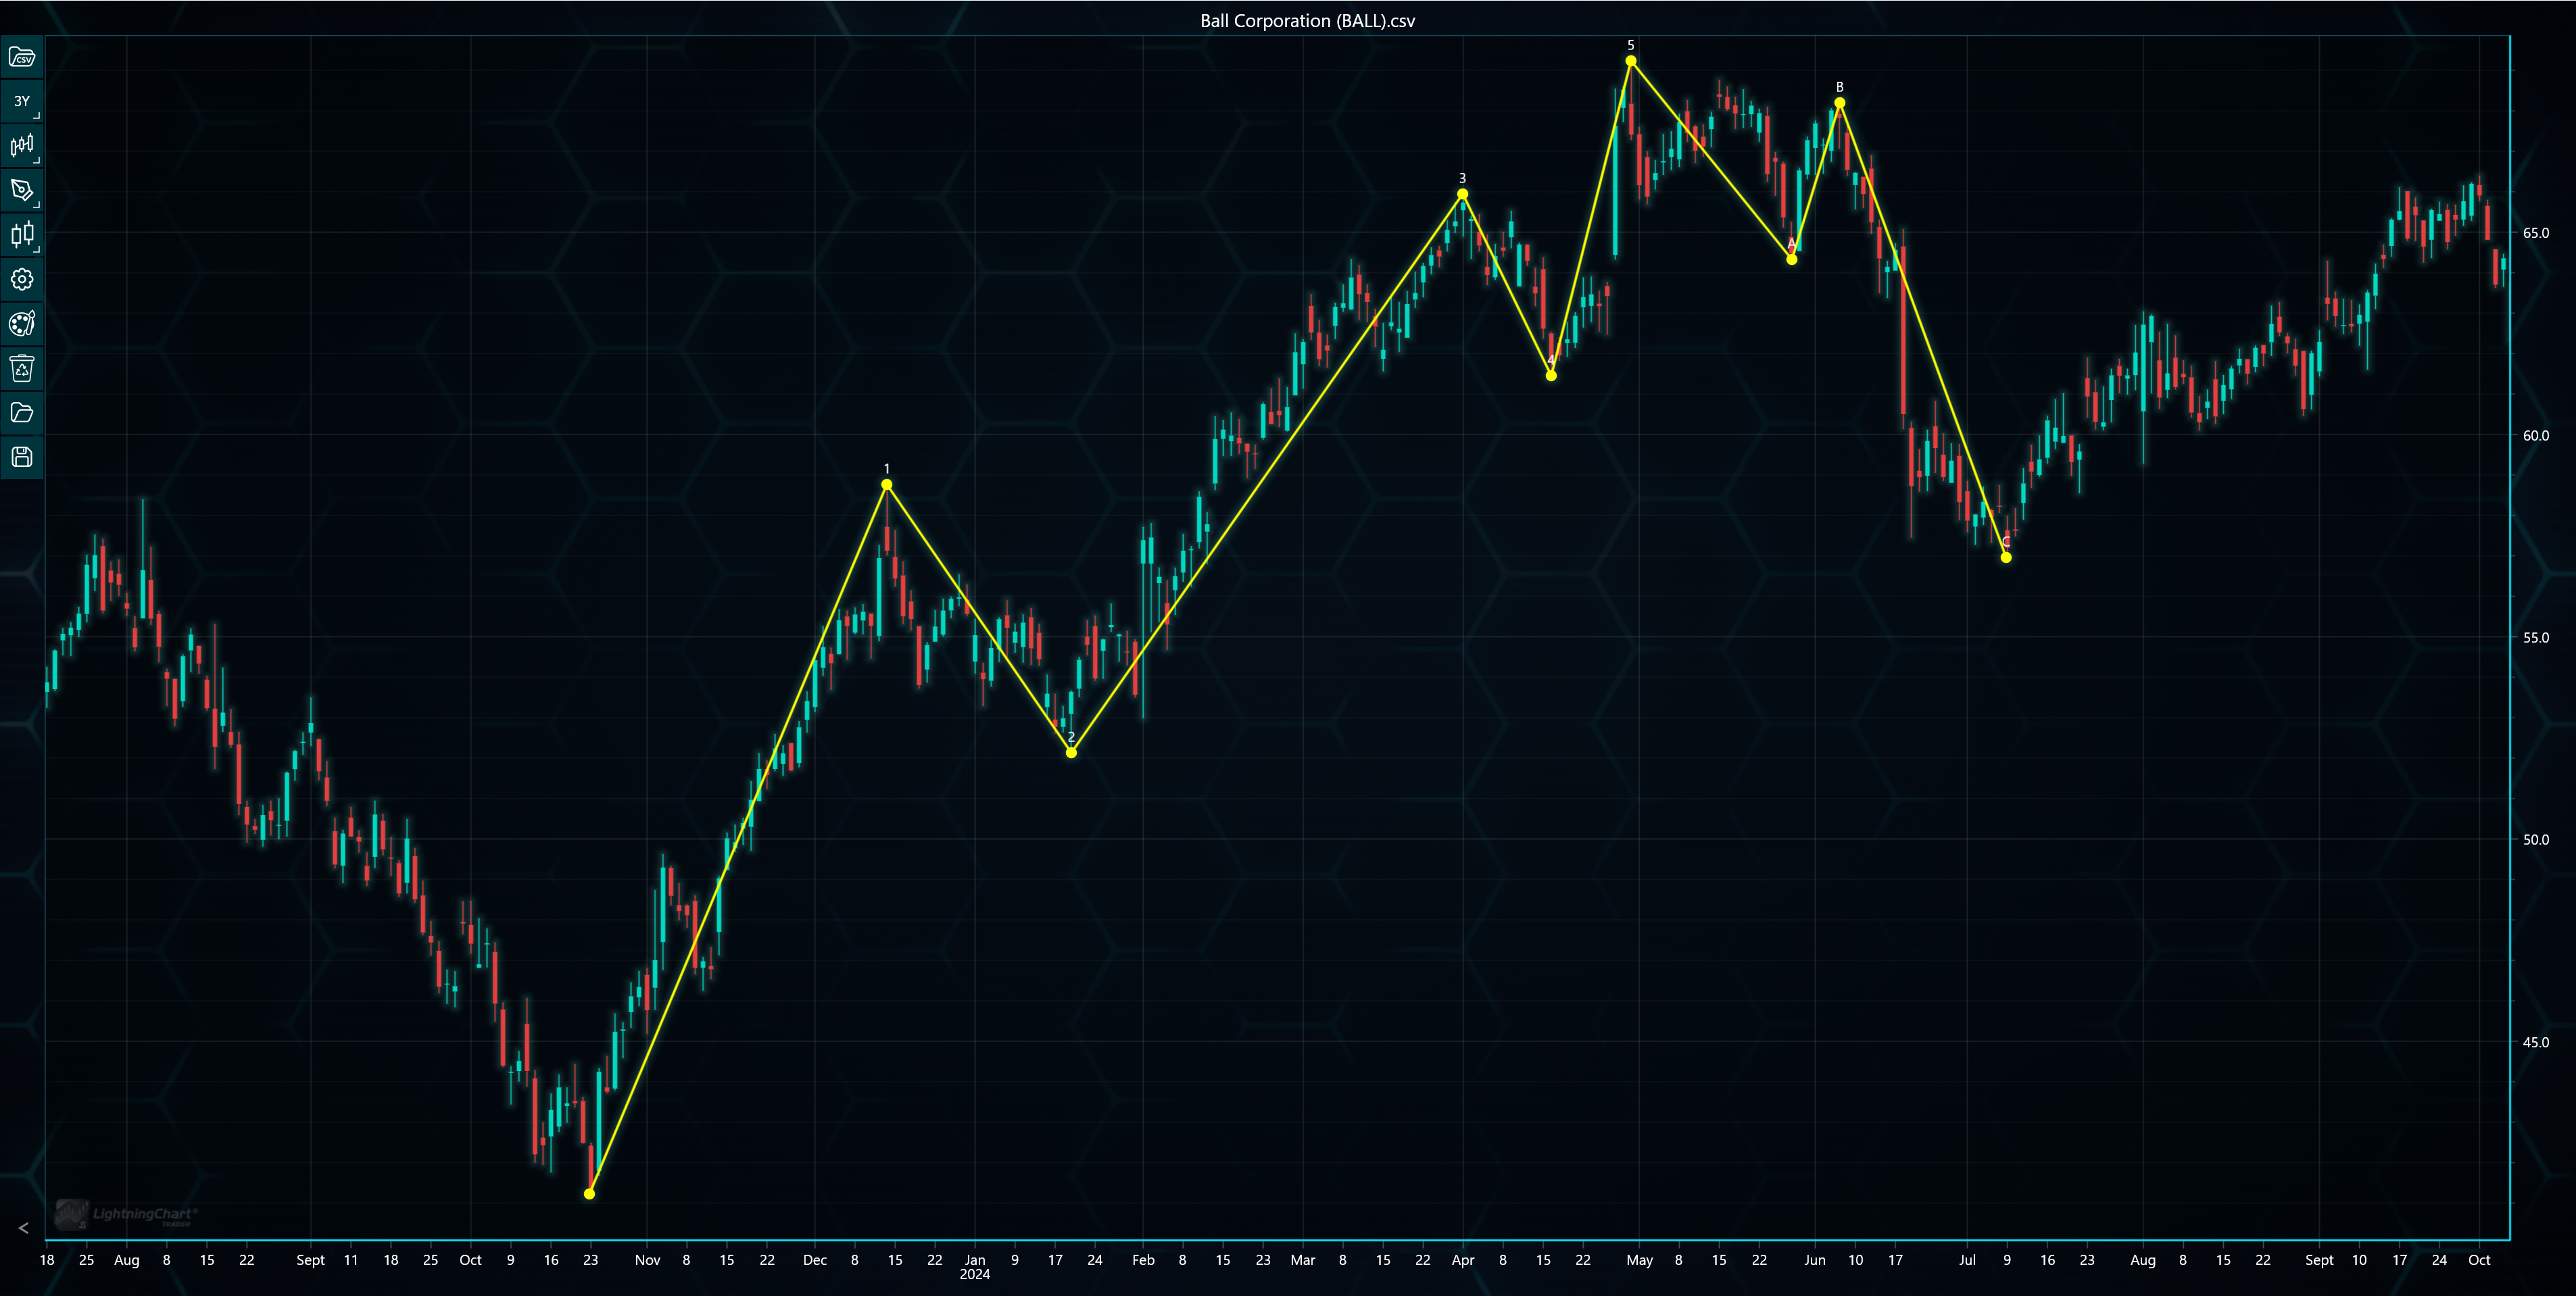
Example of an Elliot Wave in LightningChart JS Trader.
One of the most fascinating aspects of Elliott Wave Theory is its fractal structure. In many cases, each impulse wave can itself be divided into smaller five-wave patterns, while corrective waves contain their own smaller ABC structures. This means the same principles apply whether analyzing a 1-minute chart or a multi-year market cycle. This repeating nature of these patterns is one reason many traders find Elliott Wave analysis appealing.
The Three Fundamental Rules
Unlike many technical analysis methods, Elliott Wave Theory includes three strict rules that cannot be violated.
Rule 1
Wave 2 can never retrace more than 100% of Wave 1. If it does, the wave count is invalid.
Rule 2
Wave 3 can never be the shortest of the three impulse waves (1, 3, and 5). Instead, Wave 3 is often the strongest and longest.
Rule 3
Wave 4 cannot overlap the price territory of Wave 1. There are some exceptions in diagonal patterns, but this rule generally holds.
Technical Analysis with Elliott Wave Theory
Elliott Wave analysis is a versatile tool for professional traders, allowing them to identify for instance trend direction, potential reversals, and market cycle maturity. It also helps setting profit targets and stop-loss placements. As an example, if a trader identifies that Wave 3 has likely completed, they may anticipate a Wave 4 correction before preparing for the final Wave 5 advance. Similarly, after five completed waves, traders often become cautious, as an ABC correction is likely to follow.
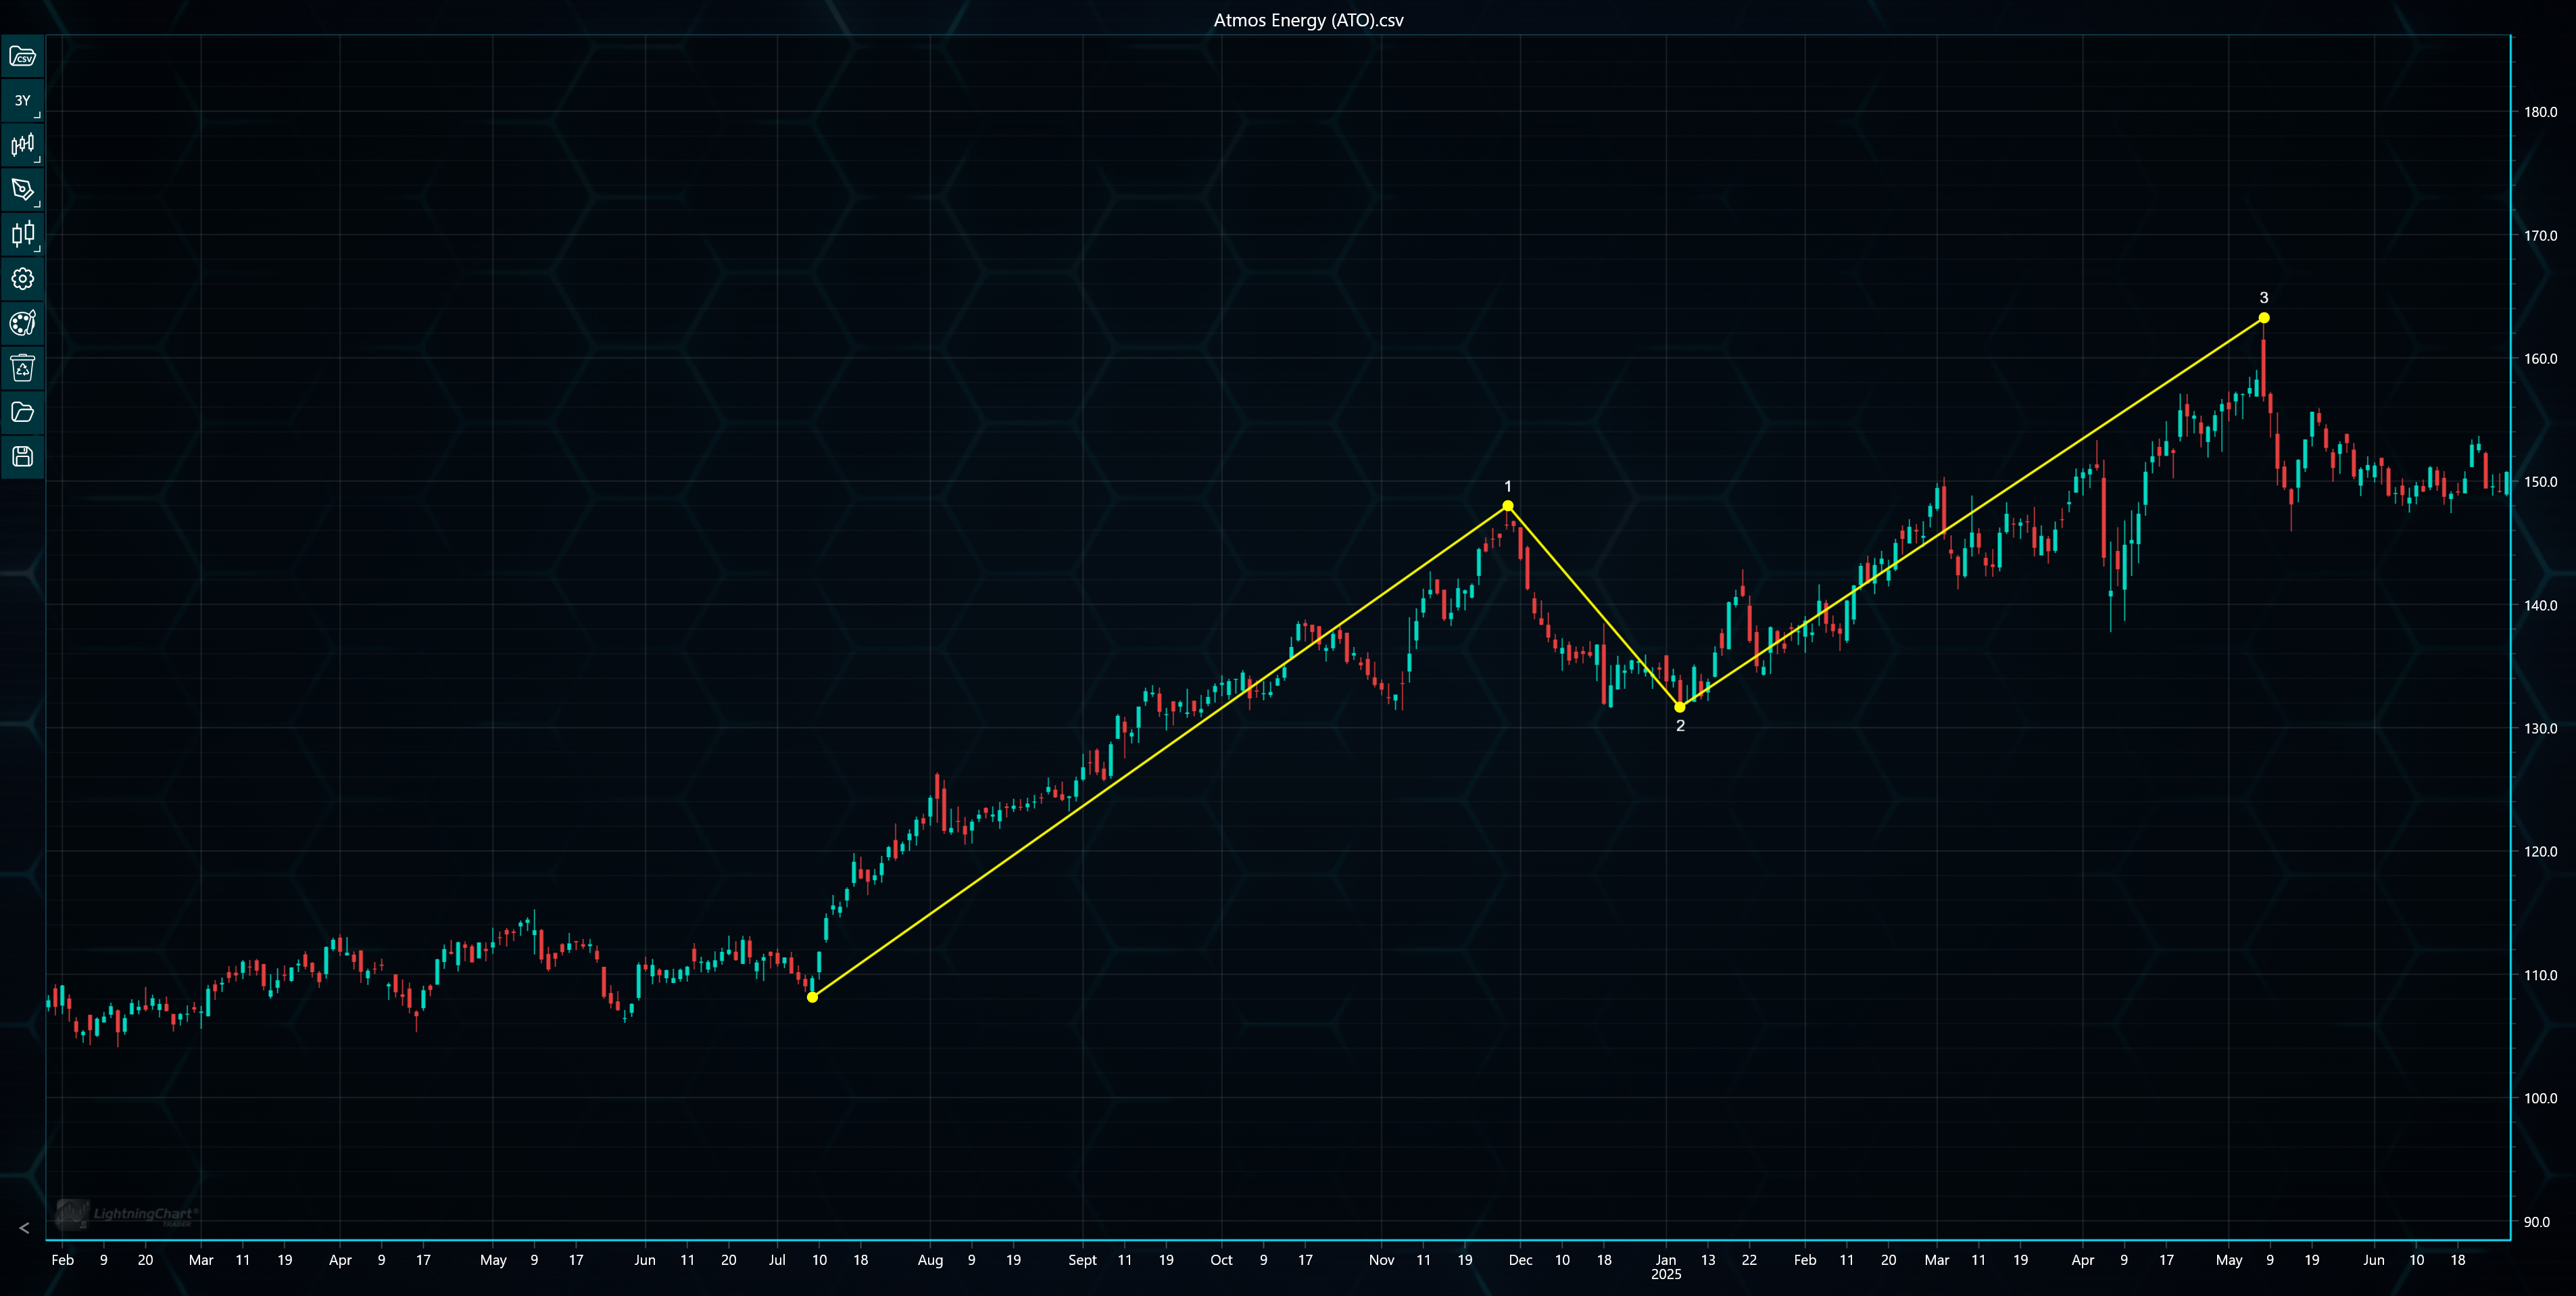
The first three waves can be drawn. The price may still rise since Wave 5 is likely to soon follow.
Because Elliott Wave counting can be subjective, many traders confirm their analysis using additional tools such as moving Averages, RSI, MACD, and volume analysis. Using multiple forms of analysis reduces the risk of relying on an incorrect wave count.
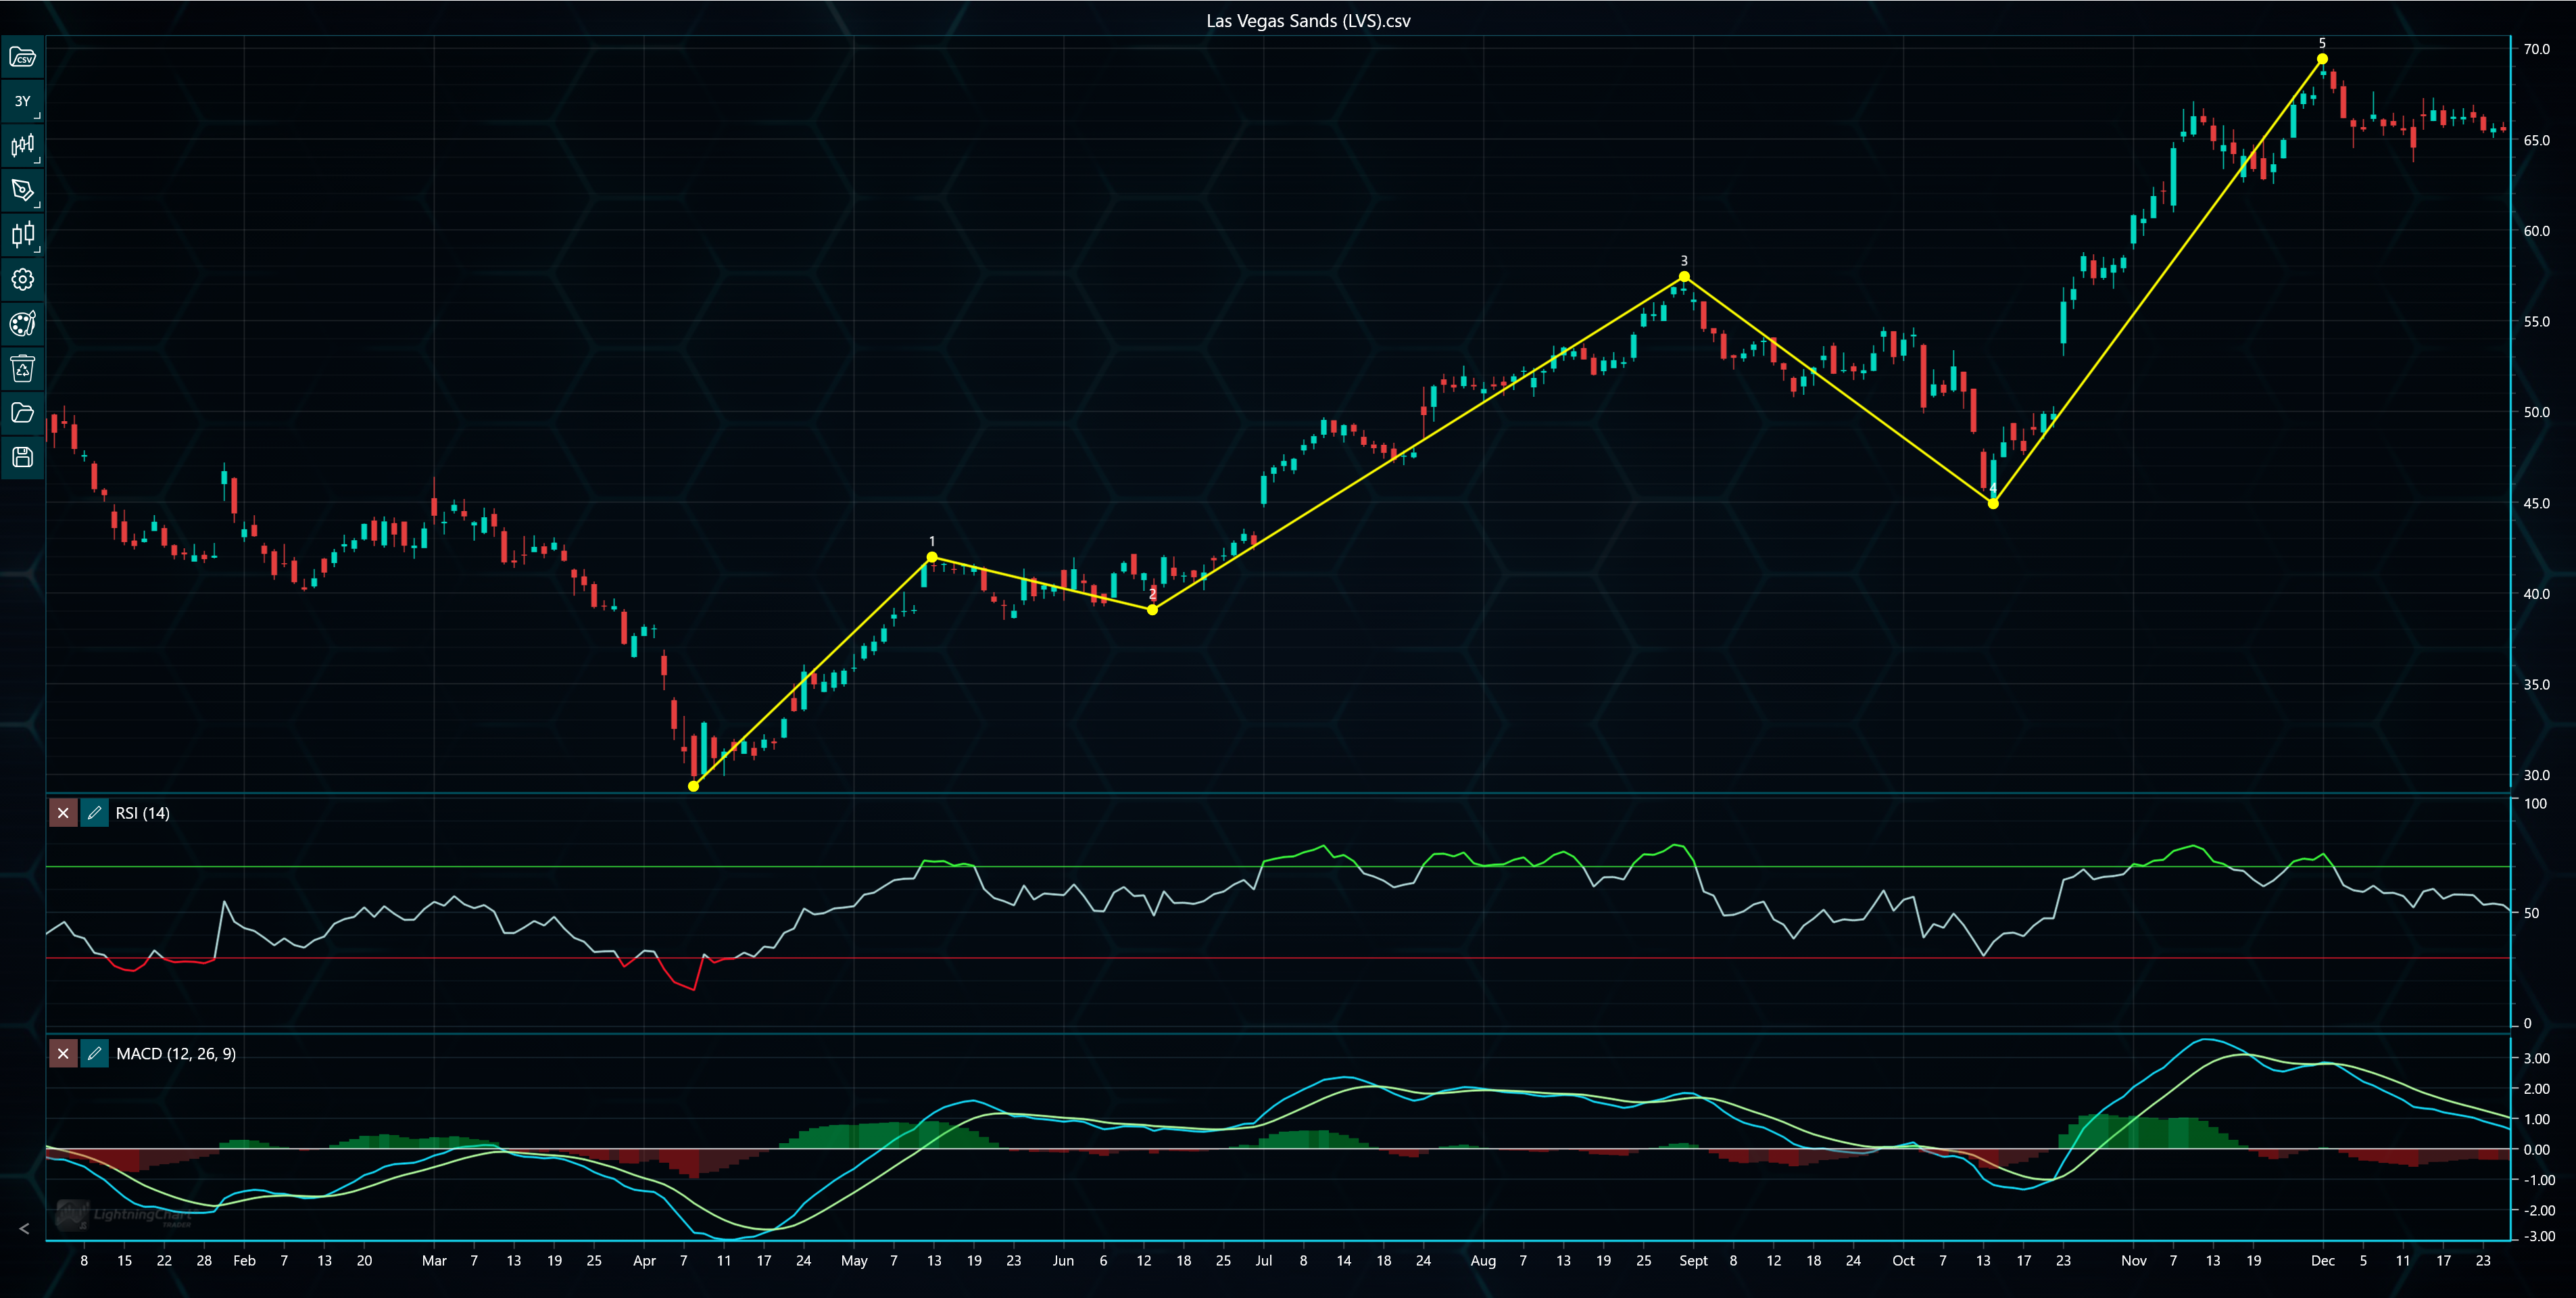
Impulse Waves have been drawn. RSI and MACD are heading down, suggesting the start of the Corrective Phase. This might be a good time to sell.
Finally, a good general advice is to never trade based solely on one wave count.
Fibonacci Ratios and Elliott Waves
Many Elliott Wave practitioners combine the theory with Fibonacci retracement and extension levels. The following table displays common relationships between various waves and Fibonacci levels.
|
Wave |
Common Fibonacci Relationship |
|
Wave 2 |
50%–61.8% retracement of Wave 1 |
|
Wave 3 |
161.8% extension of Wave 1 |
|
Wave 4 |
23.6%–38.2% retracement of Wave 3 |
|
Wave 5 |
Often equals Wave 1 or extends to 61.8% of Waves 1–3 |
These levels help traders estimate potential support, resistance, and price targets.
To learn more about Fibonacci tools in trading, check our blog post at: https://lightningchart.com/blog/using-fibonacci-tools-in-trading-a-practical-guide-for-market-analysis/
Advantages of Elliott Wave Theory
Learning Elliot Wave theory gives several benefits to traders.
At a general level, the theory helps identify market structure, allowing traders to gain a broader understanding of market cycles instead of focusing on individual candles.
Another advantage of the theory is its versatility, as it can be applied to stocks, Forex, cryptocurrencies, commodities, indices, and futures. Furthermore, the fractal nature makes it useful for both day traders and long-term investors, though the wave structures are often clearer with higher timeframes.
Finally, Elliot Wave theory improves risk management by recognizing likely wave completion points. This helps traders define stop-loss and profit targets more effectively.
Limitations
Despite its popularity, Elliott Wave Theory has also several drawbacks.
First, the theory has a complex learning curve since mastering it requires considerable study and experience.
Another limitation of the theory is its uncertainty. Wave analysis estimates probabilities rather than certainties. Markets may invalidate a wave count unexpectedly. Furthermore, interpretation is in many cases subjective as different analysts often produce different wave counts for the same chart.
Finally, Elliot Wave theory works significantly better in trending markets, as during highly volatile or sideways markets, identifying clear wave structures becomes more difficult.
Elliot Wave in LightningChart JS Trader
Most trading data visualization platforms have some form of Elliot Wave built in. In this chapter, we’ll look at one of them, LightningChart JS Trader.
LightningChart JS Trader is a high-performance financial charting solution built on the LightningChart JS platform, designed for professional trading and market analysis applications. It provides advanced interactive charts, real-time data visualization, technical indicators, drawing tools, and seamless handling of large streaming datasets. With its GPU-accelerated rendering engine, LightningChart JS Trader delivers smooth performance even with large datasets, enabling developers to build responsive, feature-rich trading platforms for web-based financial applications.
In LightningChart JS Trader, Elliot Wave can be drawn by selecting it from the drawing tool menu and patterns sub-menu found in the left toolbar. After this, all the wave points can be positioned one-by-one by simply clicking the chart.
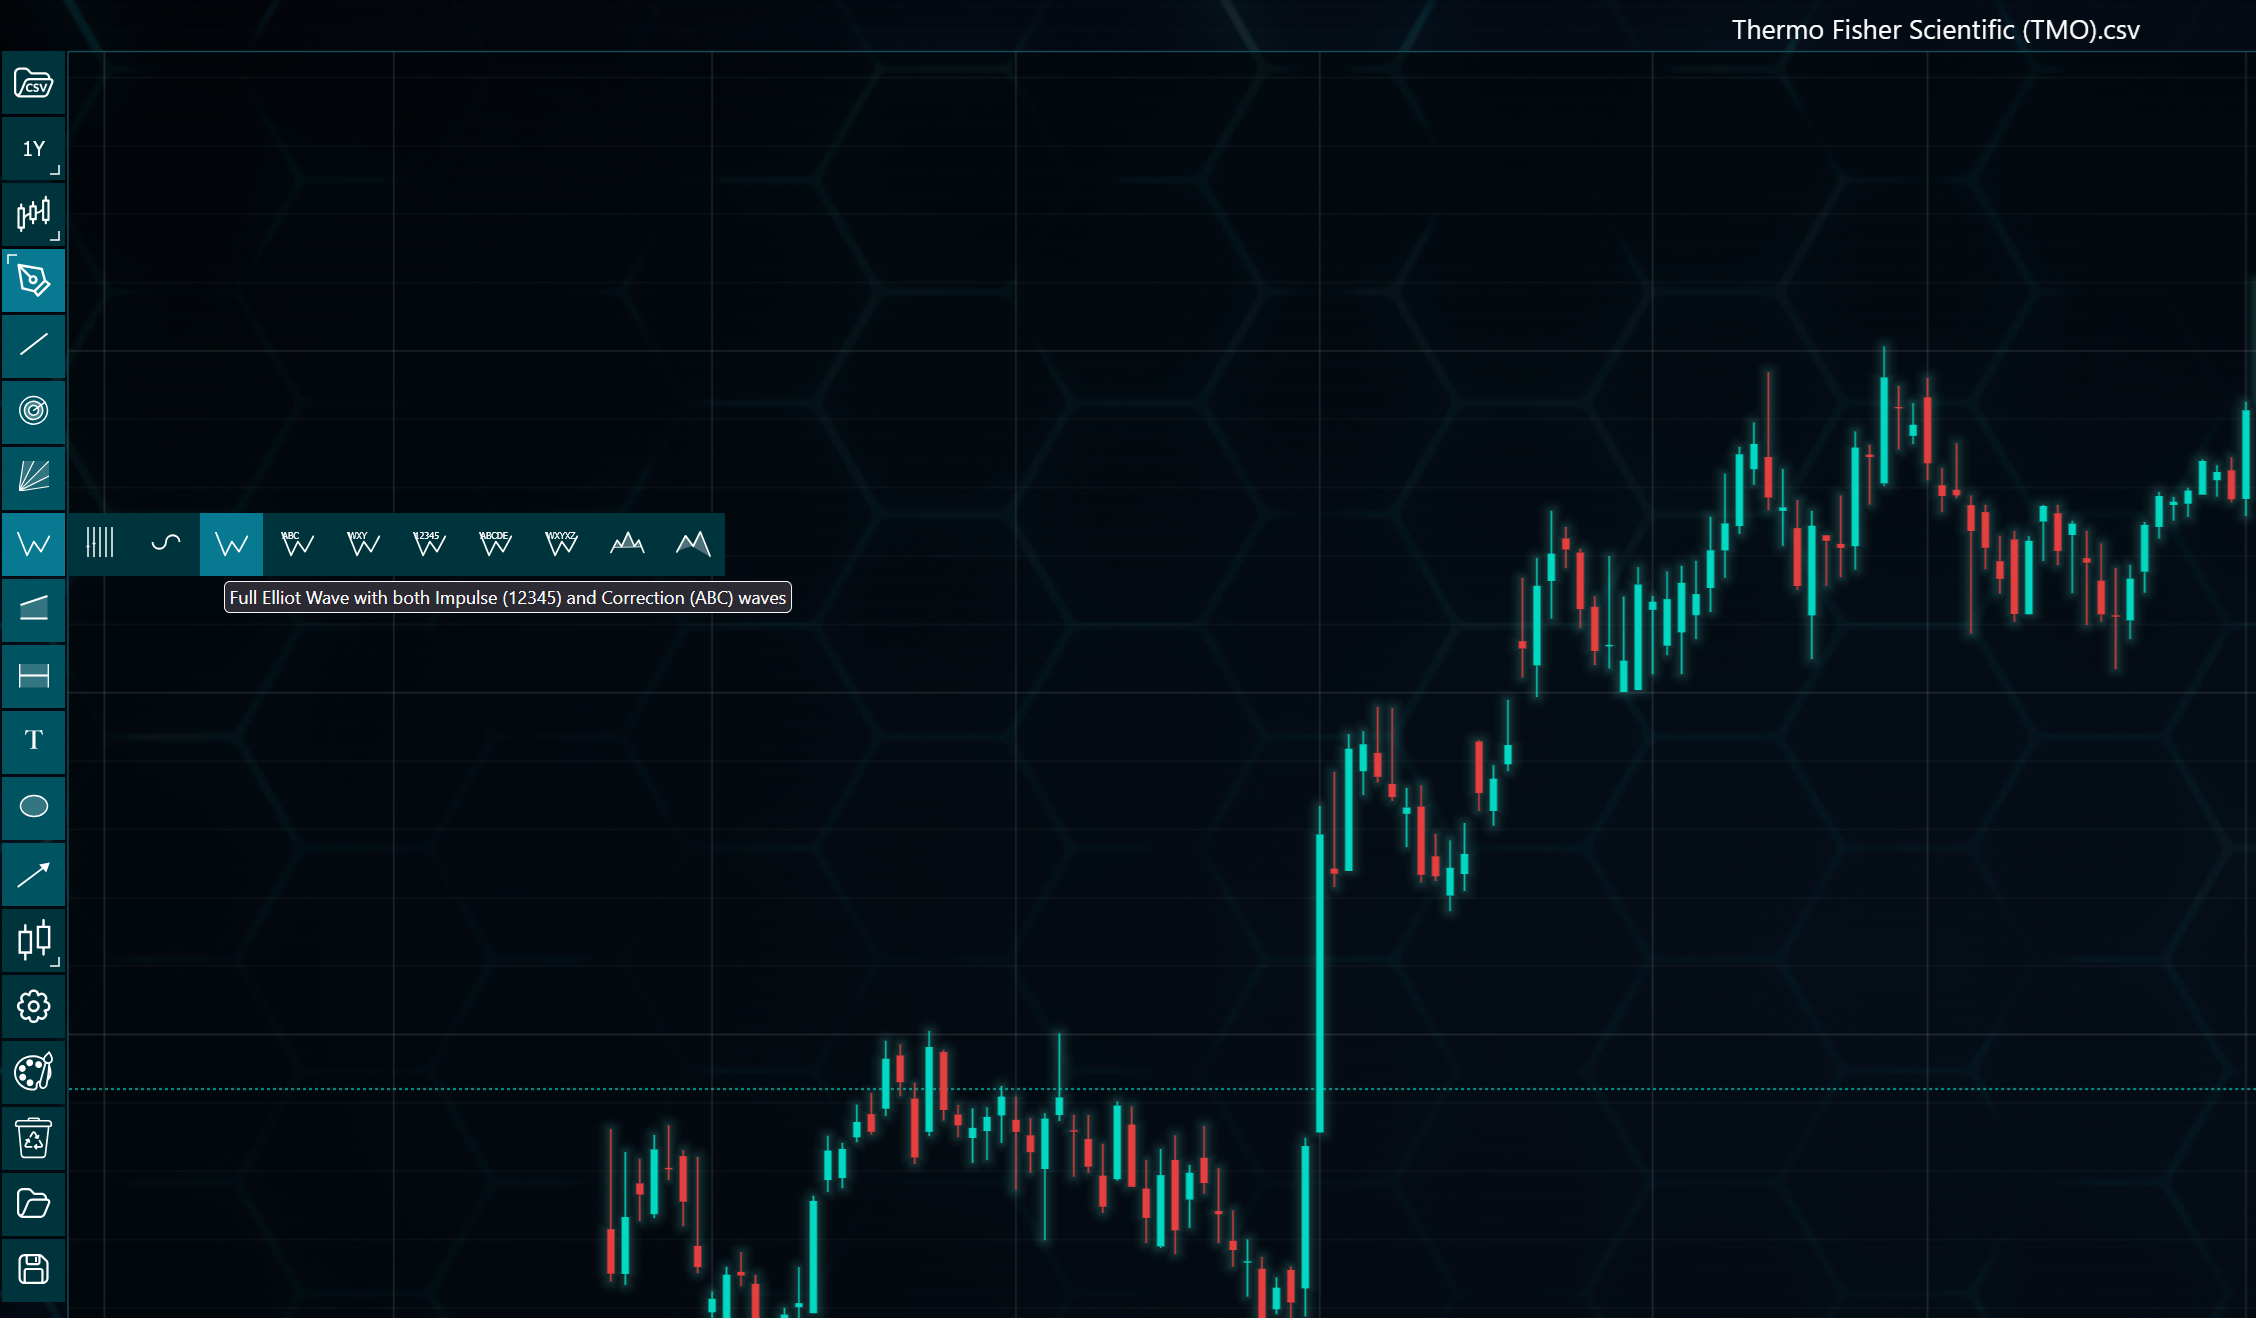
Selecting Elliot Wave in LightningChart JS Trader. Clicking the corresponding icon will initiate the drawing.
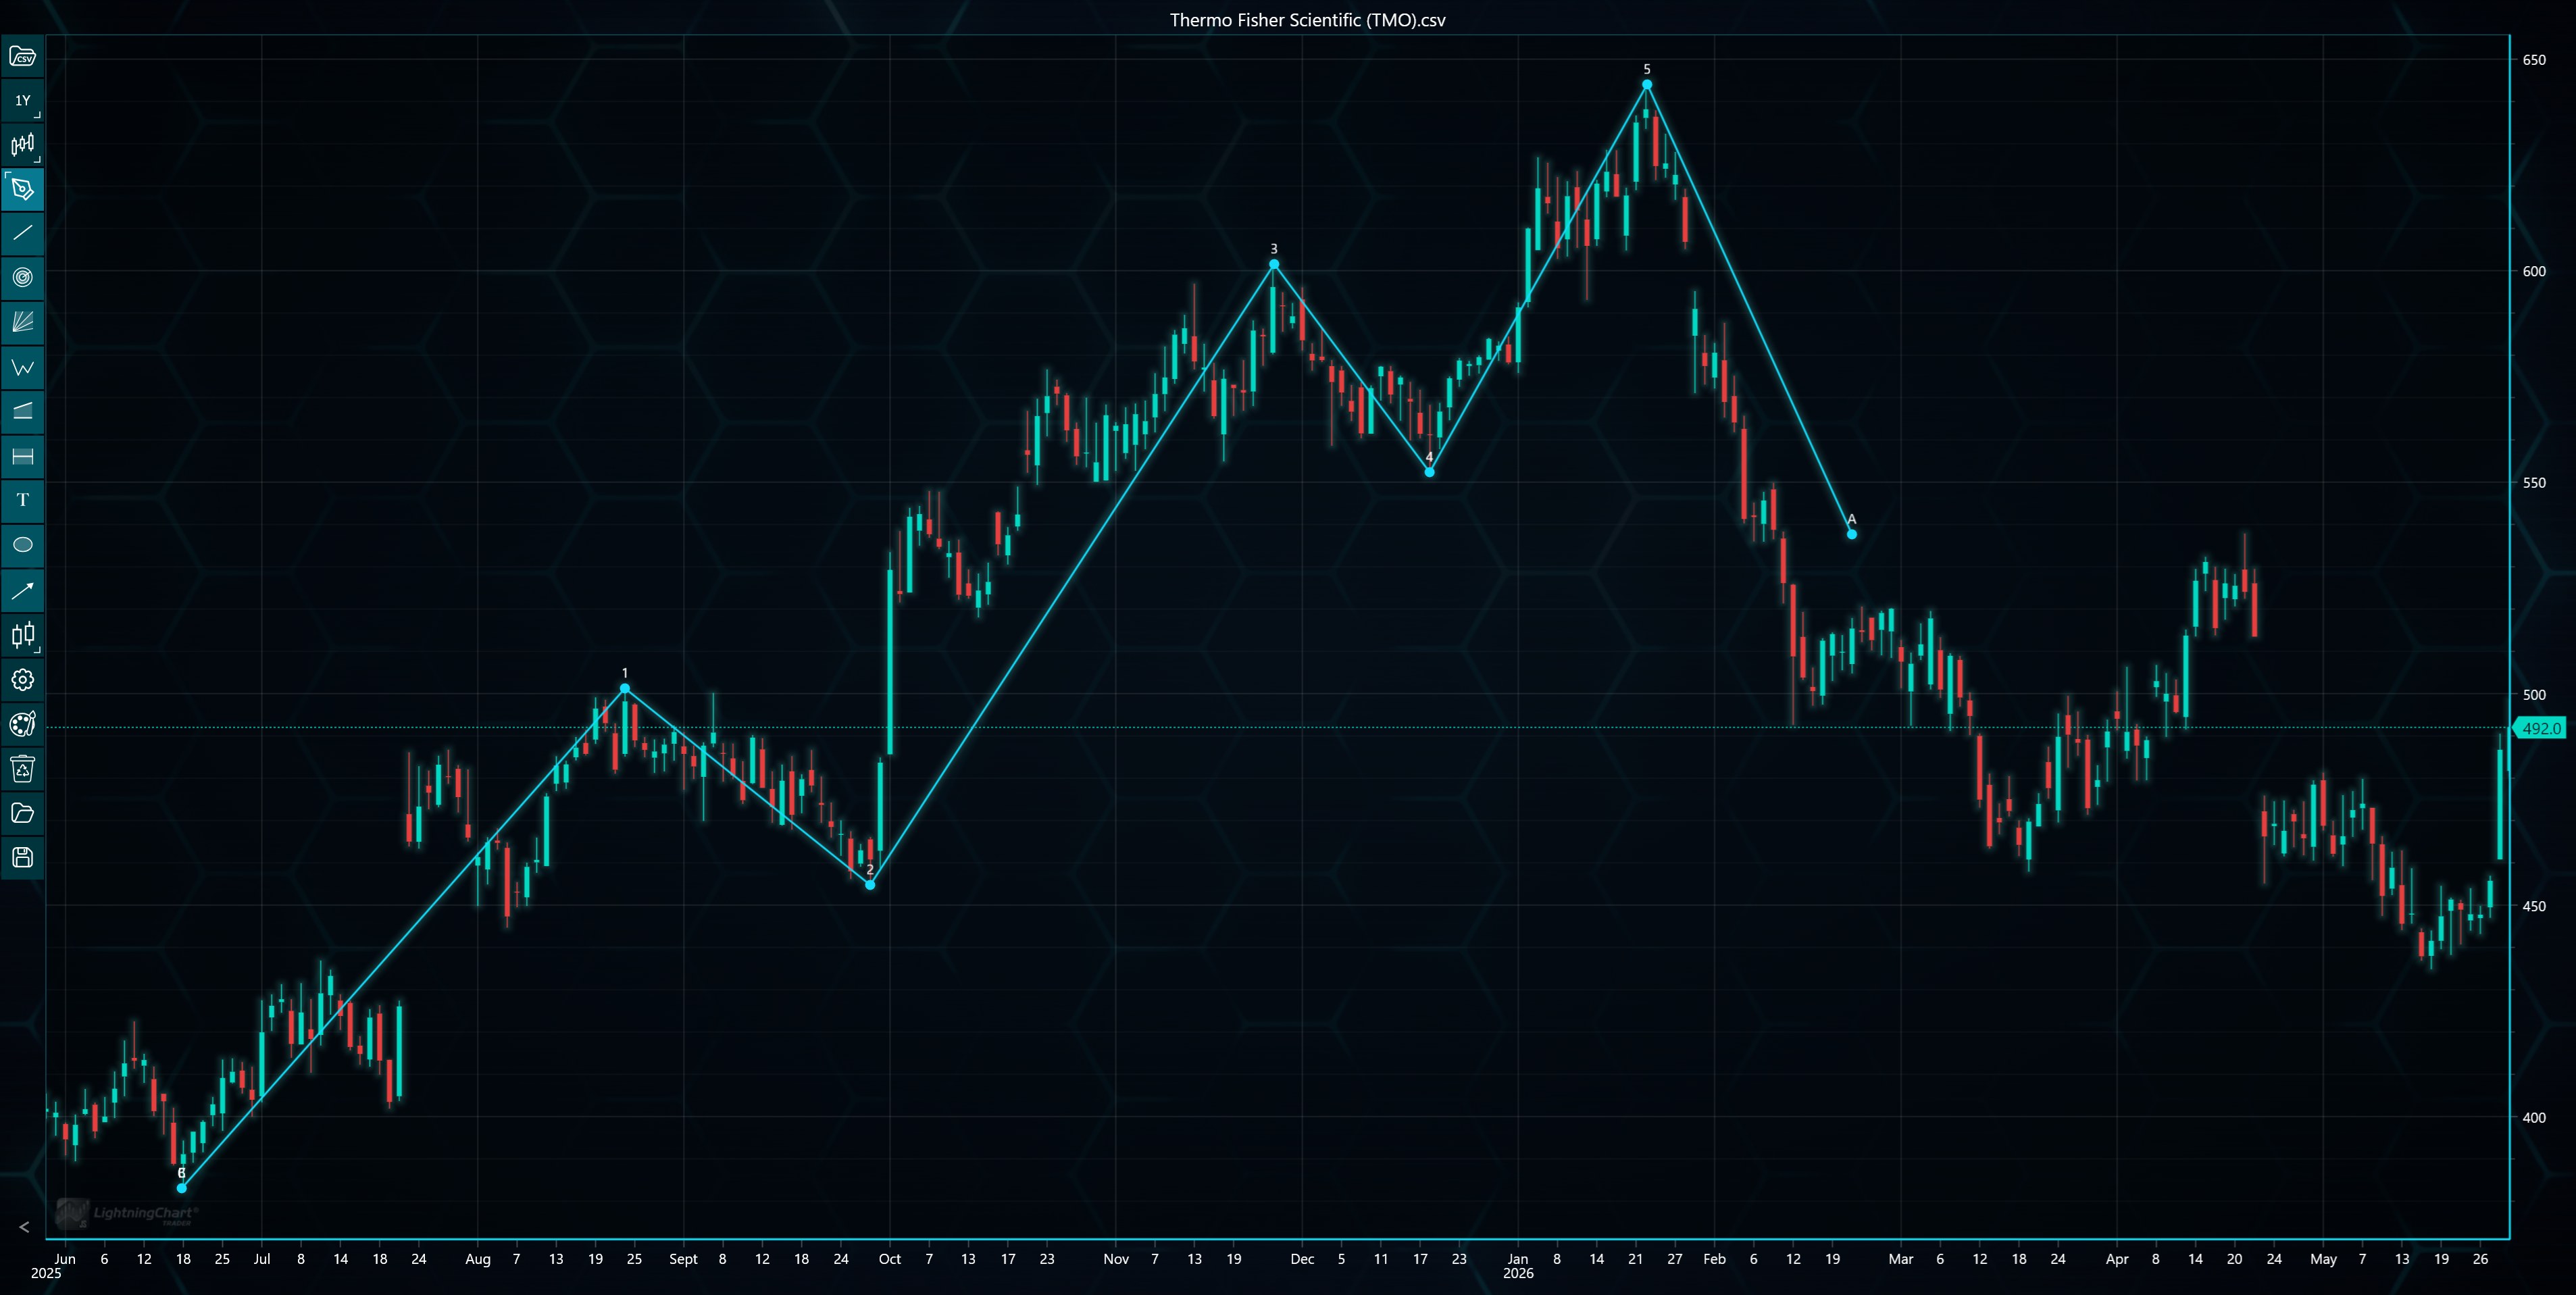
Drawing Elliot Wave. Currently determining the first point of the Correction Wave (A), after which point B and C can be placed.
LightningChart JS Trader also has an option to place drawing tools in code instead of via user interface. In case of ElliotWave, this can be done with addHeadAndShoulders() method:
tradingChart.drawingTools().addElliotWave(ElliotWaveType.ElliotWave, startX, startY…)
The method requires giving position values for each of the wave point. The first parameter determines the wave type, as LightningChart JS Trader allows displaying the full wave or only Impulse or Correction waves. Other wave types are also available such as Triangle Wave (ABCD) and Double Combo Wave (WXY).
After the Elliot Wave has been drawn, LightningChart JS Trader allows configuring its appearance via the setting menu, brought up by right-clicking (double tap in mobile) one of the points.
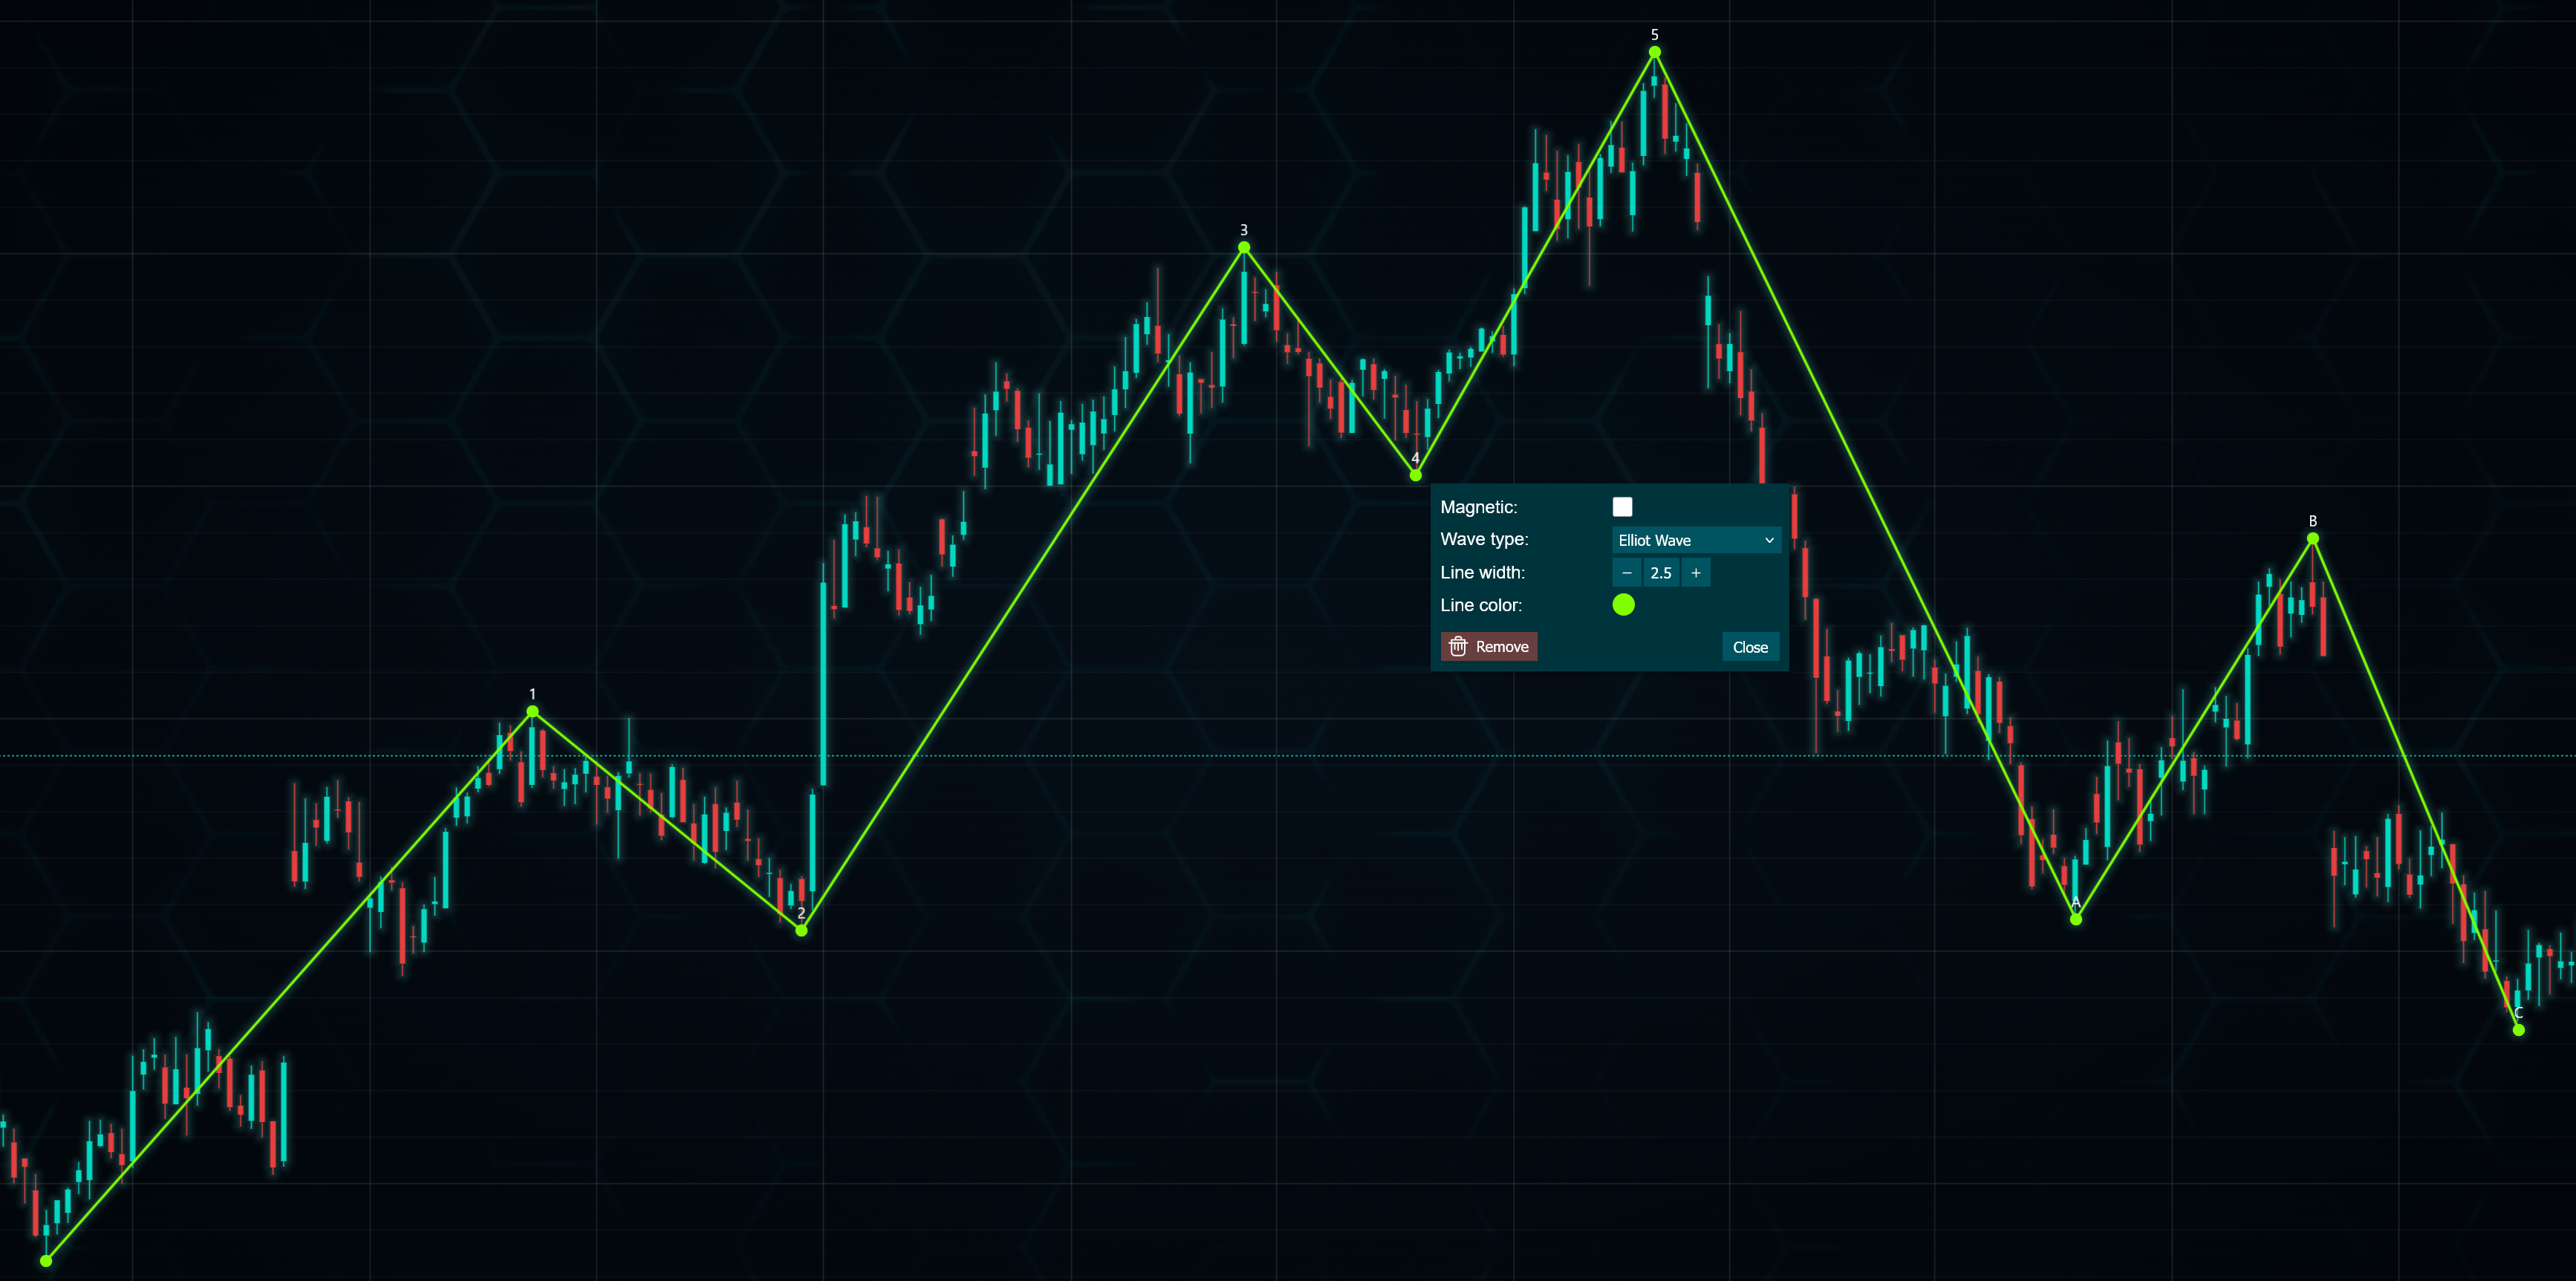
Configuring the Elliot Wave. Wave type can also be changed via the menu.
Conclusion
Although created nearly a century ago, Elliott Wave Theory is still widely used by traders and market analysts. Modern charting platforms make it easier to identify wave structures, and many institutional traders incorporate wave analysis alongside quantitative models and traditional technical indicators.
However, it is best viewed as a framework for understanding market behavior rather than a standalone prediction tool. Combining Elliott Wave analysis with sound risk management, confirmation indicators, and disciplined trade execution can improve decision-making.
While no analytical method guarantees success, Elliott Wave Theory remains one of the most influential concepts in technical analysis. Traders who invest the time to learn its principles—and combine them with complementary tools and prudent risk management—may gain a deeper perspective on how markets evolve over time.
Built better Fintech apps with LightningChart JS Trader v4.0
To learn more about this release, visit the documentation.
See more news
LightningChart .NET v.12.6.1
LightningChart .NET v.12.6.1 is out now!Features of LightningChart® .NET version 12.6.1In this release we added new features, made several improvements and fixed dozens of errors. We upgraded target framework (from .NET 8.0 to 10.0), added Universal-Data-Parser...
Trend Lines in Trading
Trend lines are among the simplest yet most powerful tools in technical analysis. They help traders visualize market direction, identify potential support and resistance levels, and make more informed trading decisions. Despite their simplicity, trend lines remain a...
Announcement: Baumer as LightningChart customer
Enabling High-Performance Visualization of Industrial Sensor Data with LightningChartDiscover how Baumer uses LightningChart to configure and visualize data from a wide variety of industrial sensors and create responsive, data-rich visualization...
Best Python Charting Library in 2026
Python's charting ecosystem is large, overlapping, and regularly misunderstood. Most comparison guides stop at Matplotlib, Plotly, and Seaborn. This one goes further: it covers what happens when your datasets grow large, your update rates increase, or your chart types...



If you have any questions, feel free to contact us!



©LightningChart Ltd 2026. All rights reserved.