ScottPlot is genuinely excellent for what it is: a free, MIT-licensed, actively developed .NET plotting library with...


Regional Account & Marketing Executive (China, Japan and South Korea)
+358 503 543 706
Book a meeting
Regional Account Manager (North America, South America)
+358 505 528 995
Book a meetingOur dedicated sales team is ready to help you find the perfect solution for your data visualization needs. Don't hesitate to reach out for personalized assistance or to schedule a demo of our products.

Regional Account & Marketing Executive (China, Japan and South Korea)
+358 503 543 706
Book a meetingRegional Account Manager (North America, South America)
+358 505 528 995
Book a meetingOur dedicated sales team is ready to help you find the perfect solution for your data visualization needs. Don't hesitate to reach out for personalized assistance or to schedule a demo of our products.


ScottPlot is genuinely excellent for what it is: a free, MIT-licensed, actively developed .NET plotting library with...
DevExpress is one of the most comprehensive UI component suites in the .NET and web ecosystem. WinForms, WPF, ASP.NET,...
OxyPlot has been a reliable reference point in the .NET scientific and engineering charting space for over a decade....

IntroductionI'm Omar, and in this article, we will use LightningChart .NET and C# to create a 3D terrain modeling...
Latest performance results: October 7th, 2022During the development of the LightningChart® .NET component, the primary...
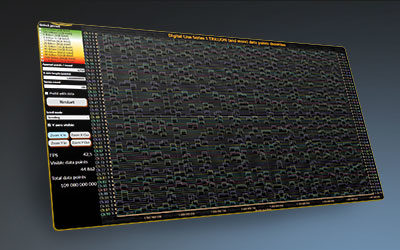
1 Trillion Data Points - video demoLightningChart .NET has broken a world record and achieved a major milestone in...
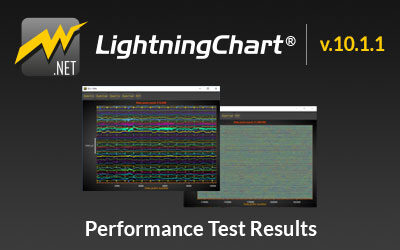
LightningChart® .NET Performance Test Results: SampleDataBlockSeries VS SampleDataSeries Introduction to the Test:...
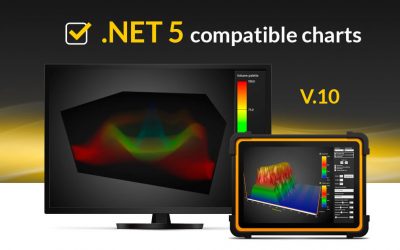
.NET 5 compatible chartsMicrosoft recently introduced .NET 5, after older .NET Framework and .NET Core. Combination of...
Real-time monitoring 8 billion data pointsThis demo shows: How shows how to plot billions of data points, in a...
Scrolling Line Plot Performance With Large Data SetsWe prepared a demo of LightningChart's unmatched scrolling line...