SampleDataSeries
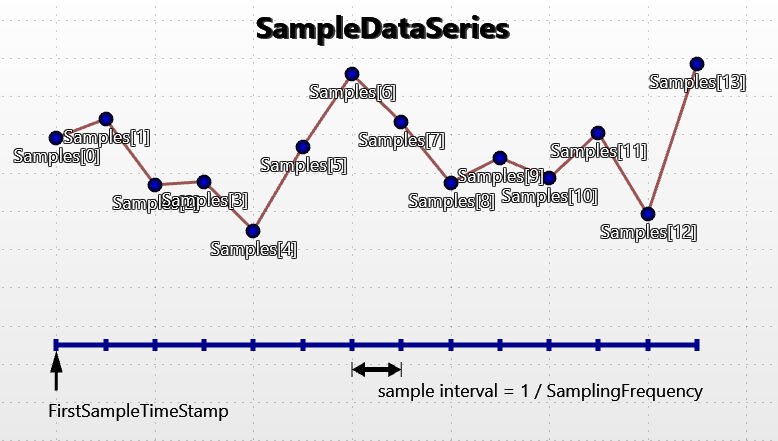
SampleDataSeries - for fixed interval progressing data. SampleDataSeries is the line series used for presenting sampled signal data (discrete signal data). This is generally used in real-time DSP applications. Visually, it is similar to PointLineSeries, so all line and point formatting options apply. As SampleDataSeries has a fixed sample interval, there’s no need to reserve memory to store point X values.
Overview of SampleDataSeries.
SampleDataSeries does not resample or down-sample the given data. All given data values are retained in the SamplesSingle or SamplesDouble arrays. LightningChart does not reduce the quality of the data or lose peaks or accuracy of the data.
Although SampleDataSeries is faster than PointLineSeries, but it is not the fastest line-series (for real-time streaming application). Another series which also requires fixed interval progressive data (SampleDataBlockSeries) is faster, but it doesn't have point-shapes and some other features. See more Line-series comparison.
Add the series to chart by adding SampleDataSeries objects to SampleDataSeries list.
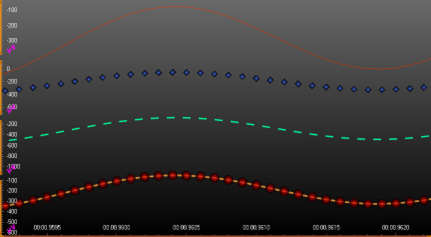
Four different SampleDataSeries (only LineVisible, only PointsVisible, dash-pattern line and both).
Y precision
The SampleDataSeries supports single and double precision sample Y values. Using single precision values is recommended when keeping the memory reserved as low as possible. Select the sample format with SampleFormat property.
X precision
Use the series SamplingFrequency (1 / sample interval) to set the fixed sample interval. To set the X value (time stamp) where the samples begin, set FirstSampleTimeStamp property.
Adding points
The samples must be added in code. Use AddSamples method to add samples to the end of existing samples.
// Add samples to the end
chart.ViewXY.SampleDataSeries[0].AddSamples(samplesArray, false);
To set whole series data at once, and overwrite old samples, assign the new samples array directly:
If SampleFormat is SingleFloat
chart.ViewXY.SampleDataSeries[0].SamplesSingle = samplesSingleArray;
Or if SampleFormat is DoubleFloat
chart.ViewXY.SampleDataSeries[0].SamplesDouble = samplesDoubleArray;
Line style
Series support LineStyle.
Points style
Series support PointStyle.
SeriesEventMarker
Series support SeriesEventMarker.
Y-value based coloring
Series support UsePalette and Y-value based coloring
Custom shaping and coloring
Series support CustomLinePointColoringAndShaping event.
DataBreaking
Series support DataBreaking by NaN or other value.
ClipAreas
Series support ClipAreas.
LineSeriesCursors
Series can be tracked with LineSeriesCursors.
DataCursor
Series can be tracked with DataCursor.
LimitYToStackSegment
Series support LimitYToStackSegment.
Rendering data into the Persistent-Rendering-Layer
Series data can be added to either PersistentSeriesRenderingLayer or PersistentSeriesRenderingIntensityLayer.
Examples
To see feature demonstration as example, check LineSeriesXYFeatures, ThreadMultiChannel and SignalReader from our Demo.