StockSeries
Stock series allow stock exchange data visualization in candle-stick or stock bars format. Several stock series can be added in the same chart by adding multiple StockSeries objects in ViewXY. StockSeries list property. Select the style with Style property. The options are Bars, CandleStick and OptimizedCandleStick.
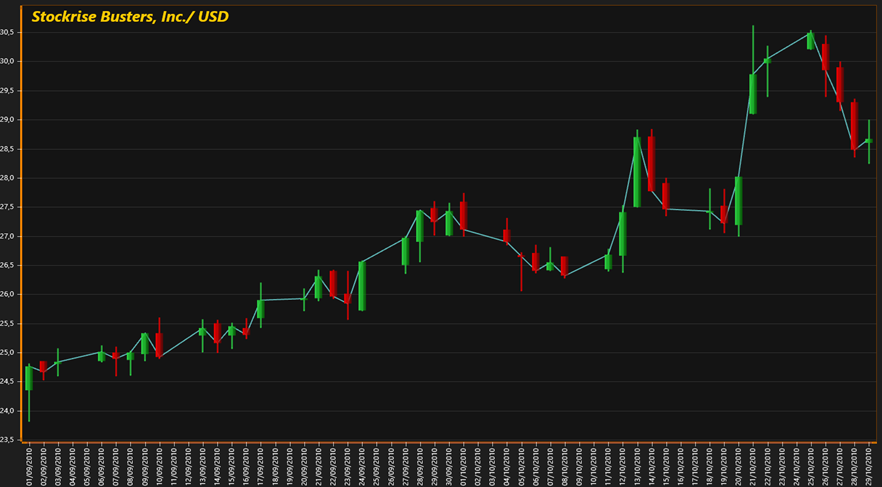
StockSeries with CandleStick Style. A light blue PointLineSeries is set to go through all Close values.
StockSeries offers only basic functionality. For more advance feature check TradingChart. Trader libraries consist of controls, tools and methods for creating trading and finance applications easily. The Trader library is built over robust and fast LightningChart API.
Styling
OptimizedCandleStick Style is used by default for performance reasons, starting from v.8.4. However, OptimizedCandleStick has only limited set of fill effects available - it only supports Solid and left-to-right direction Linear fill options (for series FillUp. / FillDown. GradientFill properties). Set Style to CandleStick for more advanced appearance options, including Bitmap, Radial, RadialStretched and Cylindrical fills and borders for the candles (FillBorder property). For maximum rendering performance, use Bars Style, with StickWidth = 1.
Set the coloring and filling options with ColorStickDown, ColorStickUp, FillDown and FillUp properties. Adjust the stick width in pixels with StickWidth property, and the total data item width with ItemWidth property.
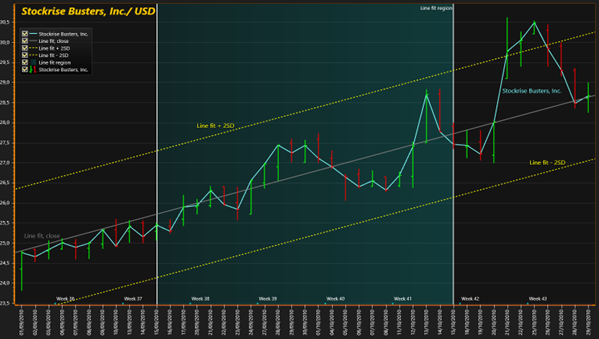
StockSeries with Bars Style. Line series are used for showing linear regression fit and offset of that line (2 * standard deviation). A band is used for selecting a date range for line fit.
Behind
StockSeries can be set to render before the line series, by setting Behind = True.
// Modifying StockSeries properties.
stockSeries.Style = StockStyle.OptimizedCandleStick;
stockSeries.ItemWidth = 13;
stockSeries.StickWidth = 3;
stockSeries.Behind = false;
Packing
StockSeries also has data Packing property, which when enabled, causes data values close to each other to be packed to a single rendered item. This improves performance, especially with larger data sets, but the data might not be as accurate as without packing.
// Enabling data packing.
stockSeries.Packing = StockSeriesPacking.On;
Setting data to a StockSeries
Create a data array and set the array items. Each item has the following fields:
Date DateTime value (year, month, day) Open Opening value of the day Close Close value of the day Low The lowest value during day High The highest value during day Transaction The total trading sum (optional) Volume Count of shares traded (optional)
Keep the data always in ascending order by Date value (oldest date first).
// Create data array
StockSeriesData[] data = new StockSeriesData[] {
new StockSeriesData(2010,09,01, 24.35, 24.76, 24.81, 23.82, 269210, 6610451.55),
new StockSeriesData(2010,09,02, 24.85, 24.66, 24.85, 24.53, 216395, 5356858.225),
new StockSeriesData(2010,09,03, 24.80, 24.84, 25.07, 24.60, 164583, 4084950.06),
new StockSeriesData(2010,09,06, 24.85, 25.01, 25.12, 24.84, 118367, 2950889.31)
 };
 // Assign the data array to series
 chart.ViewXY.StockSeries[0].DataPoints = data;
Setting X axis to date display
chart.ViewXY.XAxes[0].ValueType = AxisValueType.DateTime;
chart.ViewXY.XAxes[0].LabelsAngle = 90;
chart.ViewXY.XAxes[0].LabelsTimeFormat = System.Globalization.CultureInfo.CurrentCulture.DateTimeFormat.ShortDatePattern;
chart.ViewXY.XAxes[0].MajorDiv = 24 * 60 * 60; // Major division is one day in seconds
chart.ViewXY.XAxes[0].AutoFormatLabels = false;
// Set datetime origin
chart.ViewXY.XAxes[0].DateOriginYear = data[0].Date.Year;
chart.ViewXY.XAxes[0].DateOriginMonth = data[0].Date.Month;
chart.ViewXY.XAxes[0].DateOriginDay = data[0].Date.Day;
Set the X axis range suitable for data:
// X-axis stretched half a day at both ends. Use first and last date value.
chart.ViewXY.XAxes[0].SetRange(
    chart.ViewXY.XAxes[0].DateTimeToAxisValue(data[0].Date) - 12 * 60 * 60,
    chart.ViewXY.XAxes[0].DateTimeToAxisValue(data[data.Length - 1].Date) + 12 * 60 * 60
    );
Custom formatting of appearance
The StockSeries has CustomStockDataAppearance event handler, which can be used to format appearance of series data items individually, overriding the generic fill and color styles applied with properties. In the event handler, modify width and colors for specific points.
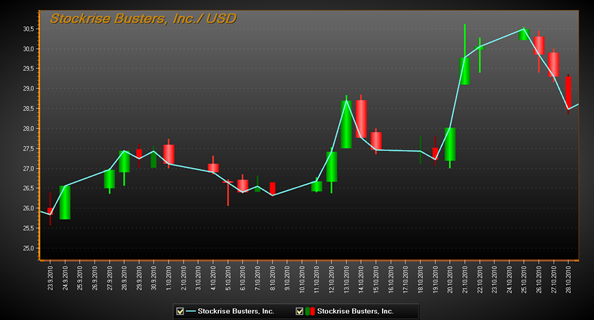
CustomStockDataAppearance used to highlight specific data items with greater width and brighter gradient colors.
Applying Scale breaks
To cut off non-trading hours and days, see ScaleBreak, at X Axis specific properties.
Examples
To see feature demonstration as example, check TradingMultiSegment, StockSeriesXY and StockTradingScaleBreaks from our Demo.