PersistentSeriesRenderingLayer
PersistentSeriesRenderingLayer can be used for extremely fast rendering of repetitive line/points data, or line/points/high-low/area fill data that is plotted in same X and Y range over and over again.
For example, consider a case of FFT monitoring: Every second 20 new data strips are received. The newest data should be visible as well as all the historic traces. But the monitoring lasts for hours. By rendering this kind of data with regular rendering, 20 * 60 * 60 = 72000 new line series are needed every hour. The PC will run out of memory probably before 1 hour is monitored. It is certain that rendering will slow down so badly that it’s not usable anymore.
PersistentSeriesRenderingLayer is kind of a bitmap, that allows adding rendering data incrementally in it. It keeps the graphics until cleared by command. This way, each update round, only one series needs to be rendered on the layer, followed by the layer rendering on the screen. CPU load or memory footprint doesn’t rise. If existing data should be faded away gradually, it can be done by multiplying the alpha of the bitmap pixels.
It is possible to create as many PersistentSeriesRenderingLayer objects as needed, and any count of series can be rendered on each of them, any update round.
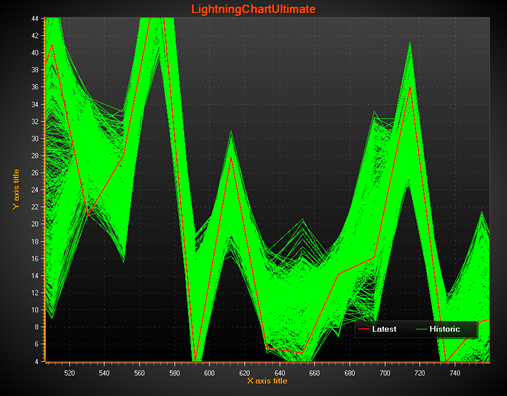
Persistent layer shows historical traces, in green color (no fading away). A regular PointLineSeries is shown over it, in red color.
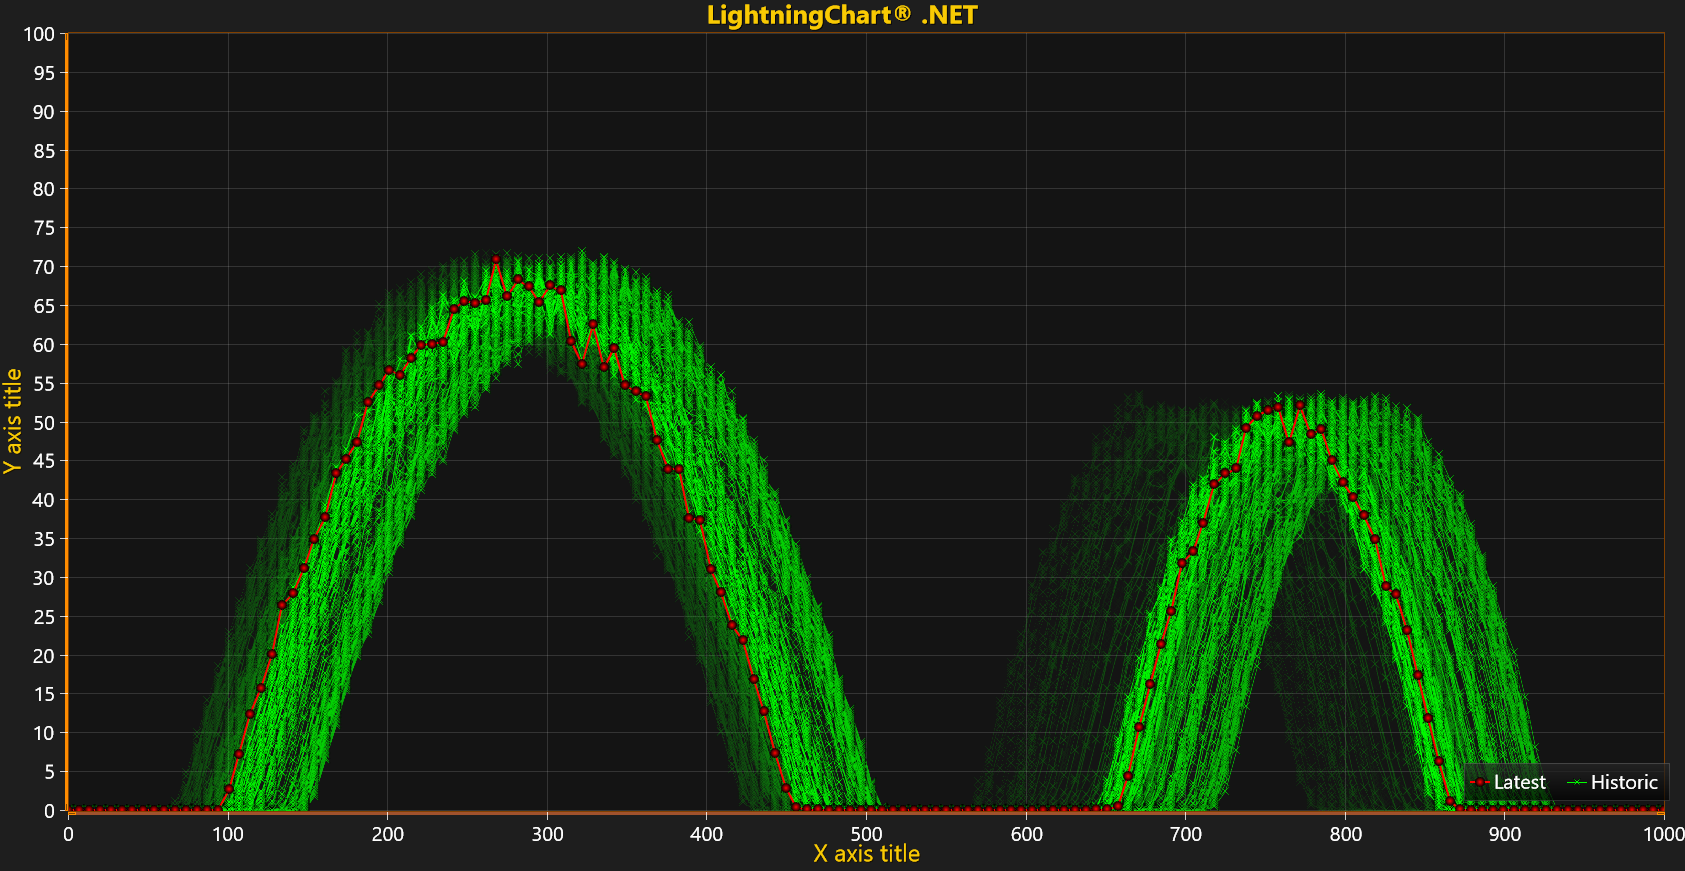
Persistent layer shows historical traces, in green color. MultiplyAlpha method is called before updating new data in the rendering layer making the oldest traces fade away.
Creating the layer
PersistentSeriesRenderingLayer is not a sub-property of ViewXY and can’t be added with Visual Studio’s property grid. PersistentSeriesRenderingLayer objects must be created in code. Create it as follows:
using LightningChartLib.[edition].Charting.Views.ViewXY;

PersistentSeriesRenderingLayer layer = new PersistentSeriesRenderingLayer
(m_chart.ViewXY, m_chart.ViewXY.XAxes[0]);
By supplying ViewXY object as parameter, it binds the layer in ViewXY. Supply the same XAxis object that is used with the series rendered on it.
Multiple layers will render in the order of creation with the chart.
Clearing the layer
layer.Clear() clears the layer and initializes the color with ARGB=(0,255,255,255).
layer.Clear(Color color) clears the layer with given color. In most cases, it’s most useful to set the same color used in the background, but set its A = 0. With black background, use layer.Clear(Color.FromArgb(0,0,0,0));
Adjusting layer alpha
MultiplyAlpha(value) allows making the layer more transparent or opaquer. Multiplying effects every pixel in the layer separately.
By supplying value < 1, transparency will be increased (decays the layer).
By supplying value > 1, opacity will be increased (brings the layer more visible).
Takes no effect with value of 1.
For example, MultiplyAlpha(0.8) sets the alpha to 80% of existing alpha. MultiplyAlpha(2) adjust it to 200%.
Rendering data into the layer
Render the data into the layer by using any of PointLineSeries, SampleDataSeries, FreeformPointLineSeries, HighLowSeries or AreaSeries objects (all belong to PointLineSeriesBase class). They can be series that have been added into ViewXY.PointLineSeries, ViewXY.SampleDataSeries, ViewXY.FreeformPointLineSeries, ViewXY.HighLowSeries or ViewXY.AreaSeries collection. A temporary series that have not been added into these collections can also be used. Fill the data in the series as usual (see series description).
Render one series on the layer call:
layer.RenderSeries(PointLineSeriesBase series)
Render all given series on the layer is more efficient than calling layer.RenderSeries(PointLineSeriesBase series) for each series separately.
layer.RenderSeries(List<PointLineSeriesBase> seriesList)
All the given series will be rendered on the layer, even if their Visible is set to False.
The X axis that used with the series must be the same as the one supplied for PersistentSeriesRenderingLayer constructor. Otherwise, the series object will be skipped.
RenderSeries is for rendering INTO the layer. The layer itself will be rendered just before regular series (PointLineSeries, SampleDataSeries, FreeformPointLineSeries, HighLowSeries, AreaSeries).
Disposing the layer
To dispose the layer and prevent it from rendering with the chart, call
layer.Dispose();
Anti-aliasing data in the layer
To anti-alias the data in the chart rendering stage, set layer.AntiAliasing to True. This enables anti-aliasing also if the hardware doesn’t support it.
Getting list of layers
ViewXY.GetPersistentSeriesRenderingLayers() returns list of all created layers, including PersistentSeriesRenderingIntensityLayers.
Some layer limitations to be aware of
Due to its special rendering technique, please keep these limitations in mind:
- X axis ScrollMode must be set to None. Real-time scrolling of X axis is not possible in this approach.
- Zooming, panning, axis adjustment and chart resize will cause the image to be in un-sync with axis ranges. These features should be disabled when using persistent plotting, or the application logic made so that it clears the layer and recreates temporarily the older line series for new layer rendering (there are event handlers for axis range change and resize).
- Chart resizing will clear the layer, as well as resuming from Windows desktop lock state.
- Mouse interactivity is not supported on the series rendered only on the layer
- EMF/SVG export, copy to clipboard in vector format, and print in vector format don’t support the layer. Only raster formats are supported.
Examples
To see feature demonstration as example, check PersistentRenderingLayer, PersistentRenderingHighLowAreas, PersistentFFT and NBodySimulation from our Demo.