LiteFreeformLineSeries
LiteFreeformLineSeries is a lighter version of FreeformPointLineSeries, that is optimized for much faster performance. However, compared to the regular series, it has less configuration options. See more Line-series comparison.
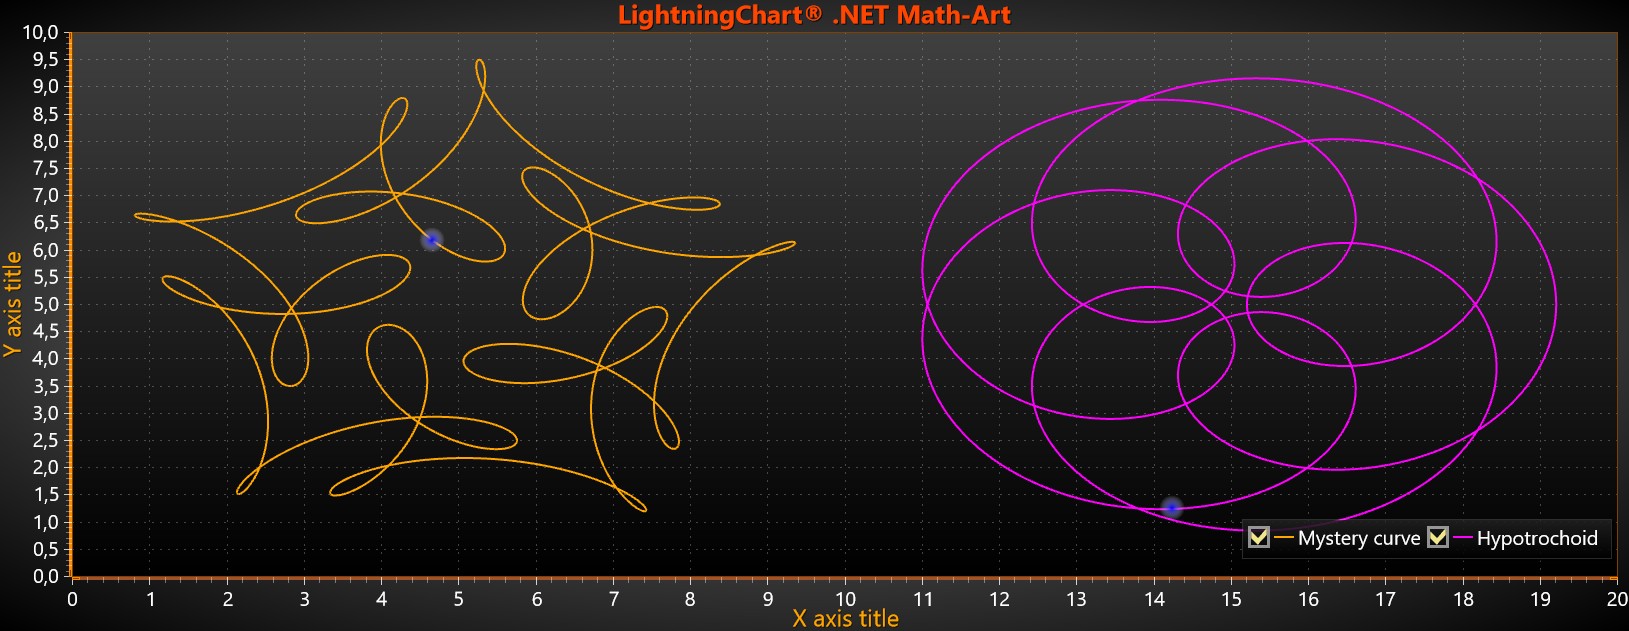
Two LiteFreeformLineSeries with SeriesEventMarker.
LiteFreeformLineSeries draws only the line between the data points but not the points themselves and therefore is not suitable for scatter plots. Furthermore, it has only Color and Width properties to adjust the series appearance. LiteFreeformLineSeries allows data points to be placed freely. In other words, the points don’t have to be in progressive order.
Adding points
Use AddPoints() method to add data point arrays to the series. These arrays should be of type double[,] where the first value is the data point index while the second value has both X (index 0) and Y (index 1) values. ActualPointCount() can be called to find out the total number of points.
// Adding a LiteFreeformLineSeries with random data points.
LiteFreeformLineSeries flls = new LiteFreeformLineSeries(_chart.ViewXY,
_chart.ViewXY.XAxes[0], _chart.ViewXY.YAxes[0]);
flls.Color = Colors.Red;
flls.Width = 3;

double[,] values = new double[21, 2];
for (int i = 0; i < 21; i++)
{
 values[i, 0] = rand.NextDouble() * 20;      // x-value
 values[i, 1] = rand.NextDouble() * 100;     // y-value
}
flls.AddPoints(values, false);
_chart.ViewXY.LiteFreeformLineSeries.Add(flls);
SeriesEventMarker
Series support SeriesEventMarker.
ClipAreas
Series support ClipAreas.
DataCursor
Series can be tracked with DataCursor.
LimitYToStackSegment
Series support LimitYToStackSegment.
Examples
To see feature demonstration as example, check LineSeriesXYFeatures and FreeformArt from our Demo.