HighLowSeries
High-low series presents data as filled area between high and low values. This belong to the group of line-series. See more Line-series comparison.
Add the series to chart by adding HighLowSeries objects into HighLowSeries list.
//Add high-low series to the chart
chart.ViewXY.HighLowSeries.Add(highlowSeries);
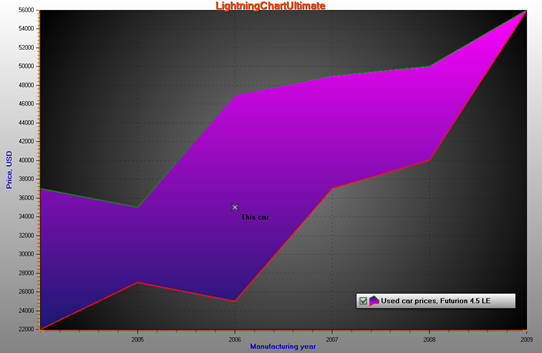
A high-low series with a marker over it.
Line style
Series support LineStyle. However, with small difference because HighLowSeries has two lines. Therefore, define the line style with LineStyleHigh and LineStyleLow properties. If the lines should not be visible, set LineVisibleHigh = false, and LineVisibleLow = false, respectively.
Points style
Series support PointStyle, but same extension. Define the point style with PointStyleHigh and PointStyleLow properties. If the points should not be shown, set PointsVisibleHigh = false, PointsVisibleLow = false.
Fill style
The fill can be set with Fill property and its sub-properties. When the high value of the data is less than its Low value, reverse fill is applied in that part. Edit the reversed fill with ReverseFill property.
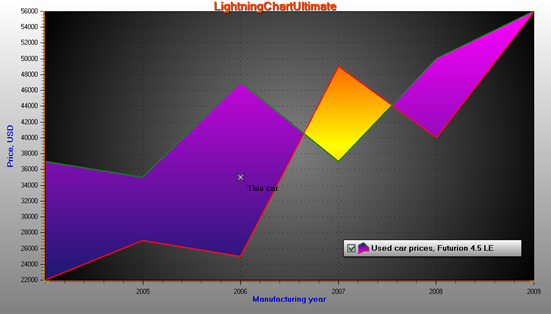
Fourth data item is given reversed: high value is < low value.
Limits
By enabling UseLimits, series shows different solid coloring above the exceed limit and below deceed limit. Values and colors are controlled by ExceedLimit, DeceedLimit, ExceedColor, DeceedColor respectively. The regular Fill and ReverseFill apply then only for the range between the limits.
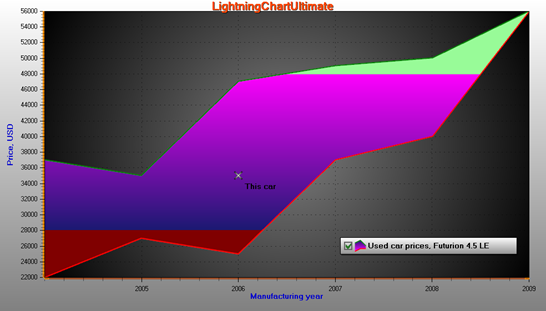
UseLimits = true, ExceedLimit = 48000 and DeceedLimit = 28000.
Y-value based Fill coloring by value-range palette
By enabling UsePalette, the fill uses ValueRangePalette steps. Uniform and Gradient coloring are both supported. In many aspects it is similar to Y-value based Line coloring.
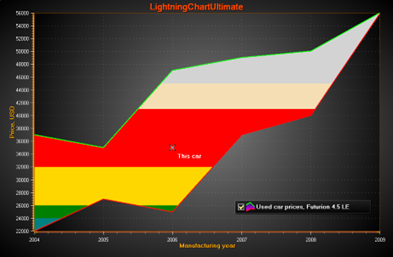
UsePalette = True, several steps defined in ValueRangePalette. Uniform coloring.
Adding data
The data values must be added in code. The data must be given in ascending order by X values, i.e.
Points[i+1].X ≥ Points[i].X.
Use AddValues(HighLowSeriesPoint[], bool invalidate) method to add data values to the end of existing values array.
HighLowSeriesPoint[]dataArray = new HighLowSeriesPoint[6];
dataArray [0] = new HighLowSeriesPoint(2004, 37000, 22000);
dataArray [1] = new HighLowSeriesPoint(2005, 35000, 27000);
dataArray [2] = new HighLowSeriesPoint(2006, 47000, 25000);
dataArray [3] = new HighLowSeriesPoint(2007, 37000, 49000);
dataArray [4] = new HighLowSeriesPoint(2008, 40000, 50000);
dataArray [5] = new HighLowSeriesPoint(2009, 56000, 56000);

//Add data to the end
chart.ViewXY.HighLowSeries[0].AddValues(dataArray, true);
To set whole series data at once while overwriting old data, assign the new data array directly:
//Assign the data into points array
chart.ViewXY.HighLowSeries[0].Points = dataArray;
SeriesEventMarker
Series support SeriesEventMarker.
DataBreaking
Series support DataBreaking by NaN or other value.
ClipAreas
Series support ClipAreas.
LineSeriesCursors
Series can be tracked with LineSeriesCursors.
DataCursor
Series can be tracked with DataCursor.
LimitYToStackSegment
Series support LimitYToStackSegment.
Rendering data into the Persistent-Rendering-Layer
Series data can be added to either PersistentSeriesRenderingLayer or PersistentSeriesRenderingIntensityLayer.
Examples
To see feature demonstration as example, check LineSeriesXYFeatures, StackedArea, TradingMultiSegment and PersistentRenderingHighLow from our Demo.