Advanced line coloring of line series
The line color can be changed based on data values, or on other external logic.
Y-value based coloring of line with value-range palette
By enabling UsePalette property of SampleDataSeries, PointLineSeries or FreeformPointLineSeries, the coloring of line is applied by the ValueRangePalette property. ValueRangePalette contains Y values and color pairs. ValueRangePalette. Type sets the Gradient or Uniform steps palette (more about palette can be found at IntensityGridSeries).
The palette coloring can be set for Y axis line too. Enable UsePalette property of Y axis and assign the preferred series in PaletteSeries property.
// Create series with palette
PointLineSeries pls = new PointLineSeries(_chart.ViewXY, axisX, _chart.ViewXY.YAxes[0])
{
    UsePalette = true
};
pls.LineStyle.Width = 5;
pls.ValueRangePalette = CreatePalette(pls);

//Color the Y axis too with the same palette
_chart.ViewXY.YAxes[0].PaletteSeries = pls;
_chart.ViewXY.YAxes[0].UsePalette = true;
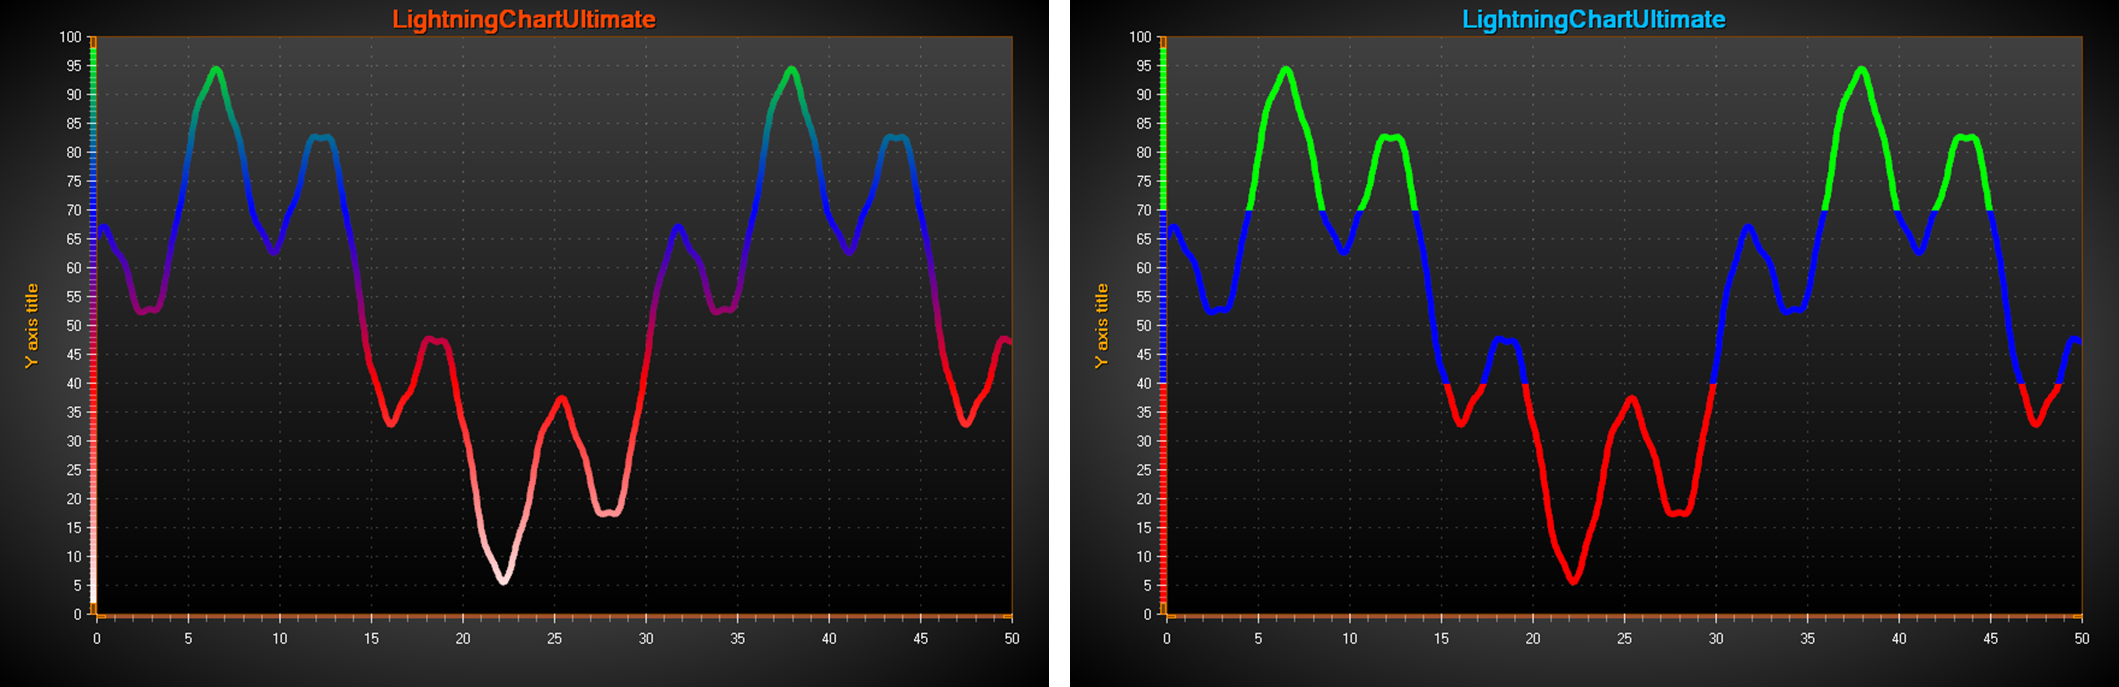
On the left, a Gradient palette is used to color the line based on Y values. On the right, a Uniform palette is used. UsePalette is enabled for Y-axis as well.
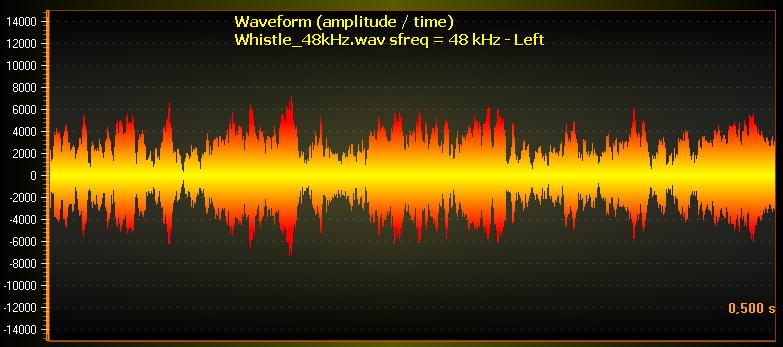
Gradient palette coloring for bipolar signal data. UsePalette for Y-axis is disabled.
HighLowSeries and AreaSeries also has UsePalette and ValueRangePalette properties, but those applied to Fill.
Custom shaping and coloring with CustomLinePointColoringAndShaping event
Custom shaping and coloring is supported in SampleDataSeries, PointLineSeries and FreeformPointLineSeries. The adjustment of coloring and coordinate can be made with CustomLinePointColoringAndShaping event, which is called just before entering the rendering stage of the chart. Custom coloring is available with all line patterns (Dash, Dot etc.). However, gradient coloring can only be applied when LineStyle. Pattern = Solid. The event also has serious limitations in vector file exports.
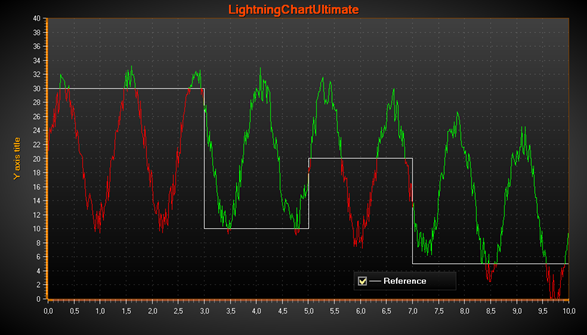
CustomLinePointColorAndShaping event handler used to change the line color by the specific changing reference level.
The event arguments have the following info:
- CanModifyColors: Colors modification is available.
- Colors: Prefilled colors array with LineStyle color. If CanModifyColors is true, modifications can be done either by assigning new values to prefilled colors, or by creating a new colors array. If CanModifyColors is false, don’t fill them.
- CanModifyCoords: Coordinates modification is available.
- Coords: Pre-filled screen coordinates array. If CanModifyCoords is true, modifications can be done either by assigning new values to prefilled coordinates, or by creating a new coordinates array. The new array length doesn’t have to be equal to prefilled one. Ensure the length of the Coords and Colors array are equal when exiting the event handler. If CanModifyCoords is false, don’t fill them.
- HasDataPointIndices: Only applicable in FreeformPointLineSeries.
- DataPointIndices: Data point indices included in the coordinate and color arrays. Subsequent points are skipped in line construction if their X and Y values or coordinates are equal. Using DataPointIndices info, e.g. a color can be picked for a line point from data point’s PointColor field or external color array.
- SweepPageIndex: If XAxis.ScrollMode = ‘Sweeping’, tells the page index (0 or 1).
Examples
To see feature demonstration as example, check LineSeriesXYFeatures, MultiColorLineEvent, ExampleMultiColorLinePalette, SpectrogramLayoutCursors, MultiColorLineIndicesXY and ThreadMultiChannel from our Demo.