BarSeries
BarSeries allows displaying data as horizontal or vertical bars.
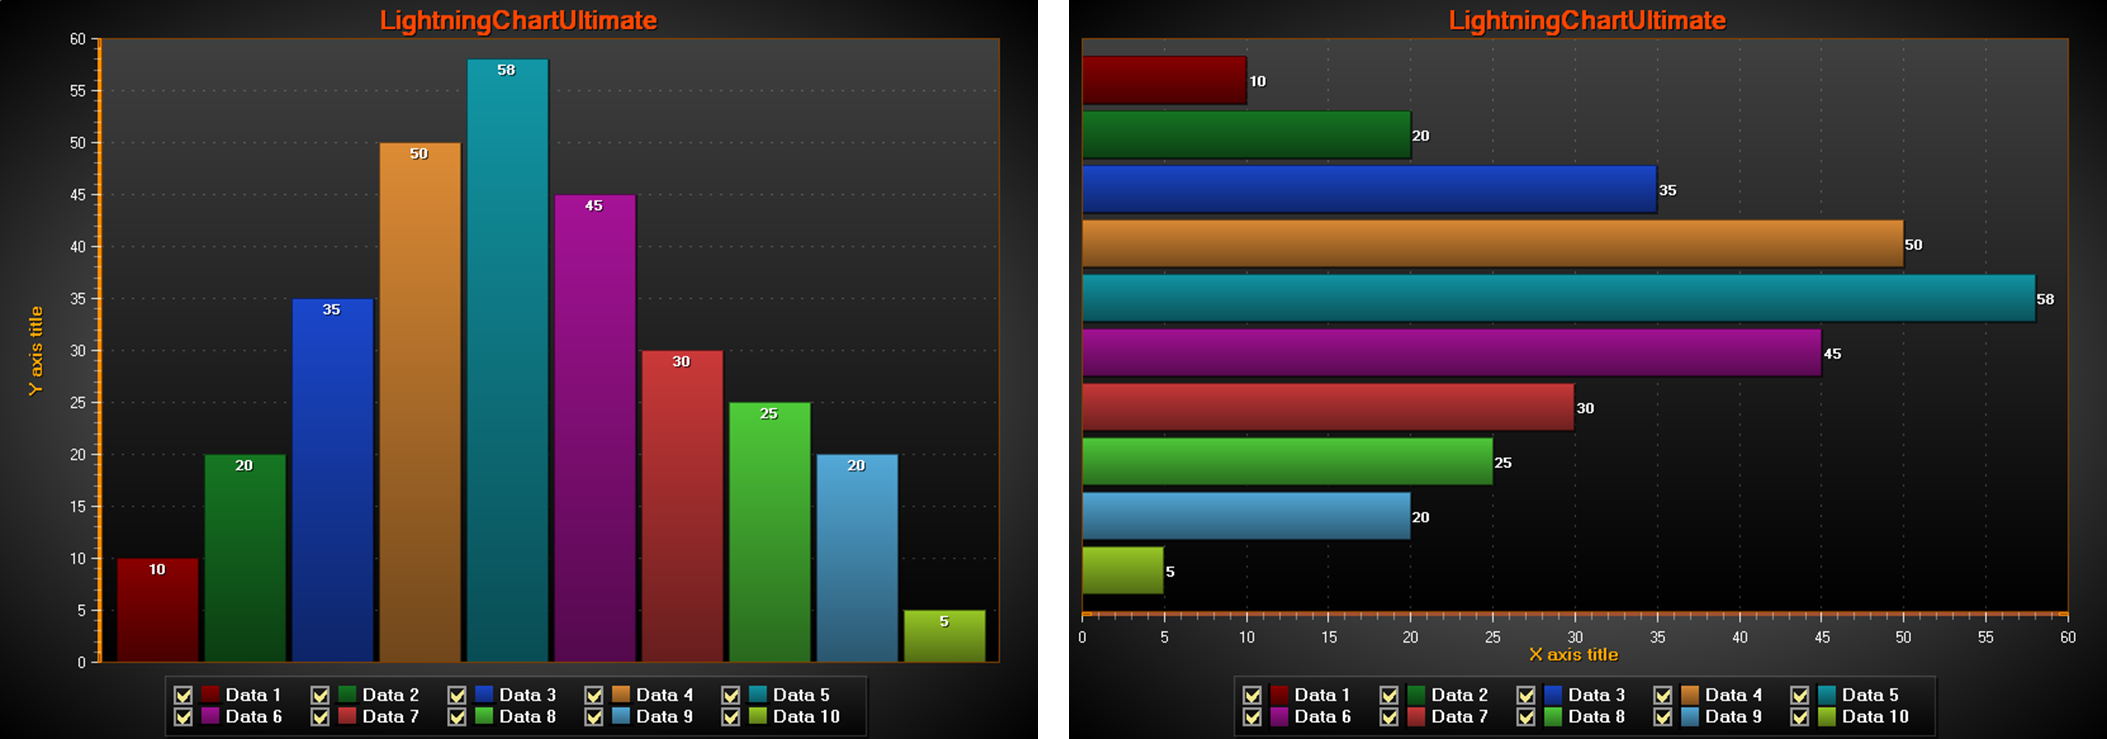 Bars series, vertical and horizontal.
BarSeriesValue
Use Values array property to store the values of a bar series. Add values with AddValue(…) method. Update an existing value by given value index with SetValue(…) method. The values are of type BarSeriesValue, which has the following fields:
- Value The bar length.
- Location X axis location of the bar (vertical presentation) or Y axis location (horizontal presentation).
- Text The text that appears in the bar.
BaseLevel
BaseLevel property in BarSeries is the series minimum value for all values and sets bar start position. In Stacked view, it will increase (if positive) or decrease (if negative) the size of the bar. If StackedToSum, the bar size is relative and calculated like Stacked.
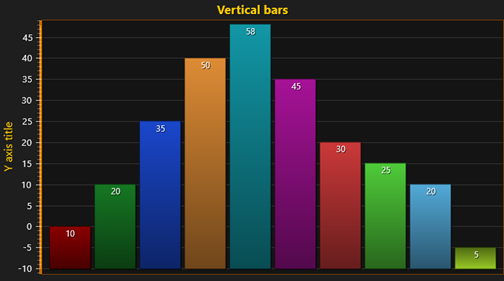 BaseLevel set to -10. Bar values are 10, 20, 35, 50, 58, 45, 30, 25, 20, 5.
LabelStyle
Use LabelStyle property of a bar series to control how the bar value label appears on the chart. The label value text is set by parameter of AddValue(…) or SetValue(…) method. Various fill styles can be used by setting Fill property and its sub-properties. Angle, Border, Color, Font, Offset, VerticalAlign, HorizAlign are among other properties control label's style.
BarViewOptions
Some of more general bars rendering properties are controlled by ViewXY. BarViewOptions. Use BarViewOptions property of the chart to control how the bars are displayed: including orientation, stacking, stretching etc.
Orientation
BarViewOptions. Orientation properties is to select between Horizontal and Vertical bar orientation (as in above picture).
Grouping
BarViewOptions. Grouping allows grouping the bars by value indices (ByIndex), by indices using width fitting (ByIndexFitWidth) or by location values (ByLocation). It brings values from different BarSeries visually together. If no grouping is wanted, user should use Grouping = BarsGrouping.ByLocation and set different Location field for every BarSeriesValue object.
Axis value has meaning only for BarsGrouping. ByLocation. Then bars are centered around Location value. If BarViewOptions. Grouping set as ByIndex or ByIndexFitWidth, bars are not bind axis and corresponding axis panning has no effect on bar position.
Bar width control for different Grouping
- When Grouping is set for ByIndexFitWidth, BarSpacing, IndexGroupingFitGroupDistance and IndexGroupingFitSideMargins properties control distance between bars in the same group, between groups (group is formed for each BarSeries.Values index) and from graph edge in pixels respectively. Therefore, individual bar width will be adjusted to fit all bars in available graph area with predefined spacing.
- In contrast, when Grouping is set for ByIndex or ByLocation, the BarThickness property of the bar series determines the bar width.
Stacking
The groups can be stacked by setting BarViewOptions. Stacking to Stack or to StackStretchToSum. When using StackStretchToSum, define the target sum by setting StackSum property. It is 100 by default to represent 100 %.
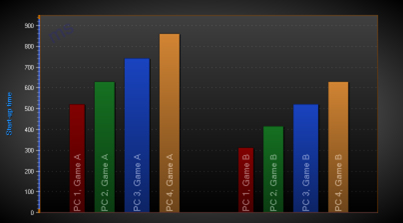 Bars series Grouping = ByIndex, Stacking = None.
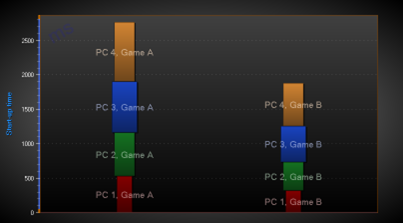 Bars series Grouping = ByIndex, Stacking = Stack.
 Bars series Grouping = ByIndex, Stacking = StackStretchToSum. StackSum = 100.
To see feature demonstration as example, check BarSimple, BarSimpleHorizontal, Negative values and StackedBars from our Demo.
If only solid color bars are needed without labels, and especially when bars count is more than 100, the LineCollection is recommended to be used instead of BarSeries. With LineCollection simply bars can be drawn and performance and will be better.