Which line series should be used?
LightningChart® .NET component offer wide range 2D (ViewXY) charts. For each type of data one or more Series can be used. In particular, line-series type of chart/plot has very broad selection of Series. This article is to explain why particular line-series type should be used, what are tradeoff and what are the assumption of each line-series.
From LightningChart version 10.3.1 the list (of line-series) expanded to 10 series: AreaSeries, DigitalLineSeries, FreeformPointLineSeries, HighLowSeries, LiteFreeformLineSeries, LiteLineSeries, PointLineSeries, SampleDataBlockSeries, SampleDataSeries, LineCollection.
Summary table
Progressive increase of X-values
Or assumption about order of X-value in data array. One of primary criteria for selection of optimal line-series is the order of X-values in data array. If X-values in progressively increasing order at fixed interval, then SampleDataBlockSeries, SampleDataSeries should be used. This is generally used in real-time Digital signal processing (DSP) applications. The digital signal would be represented as sequence of numbers that samples a continues variable in time or space. Both series types are made for fixed-interval data monitoring, used typically in waveform visualization, e.g., medical monitoring (ECG/EKG, EEG, EMG, ExG), vibration monitoring, telemetric and data logger systems, and the audio engineering industry. Use the series SamplingFrequency property (1 / sample interval) to set the fixed sample interval. To set the X value (time stamp) where the samples begin, set FirstSampleTimeStamp property.
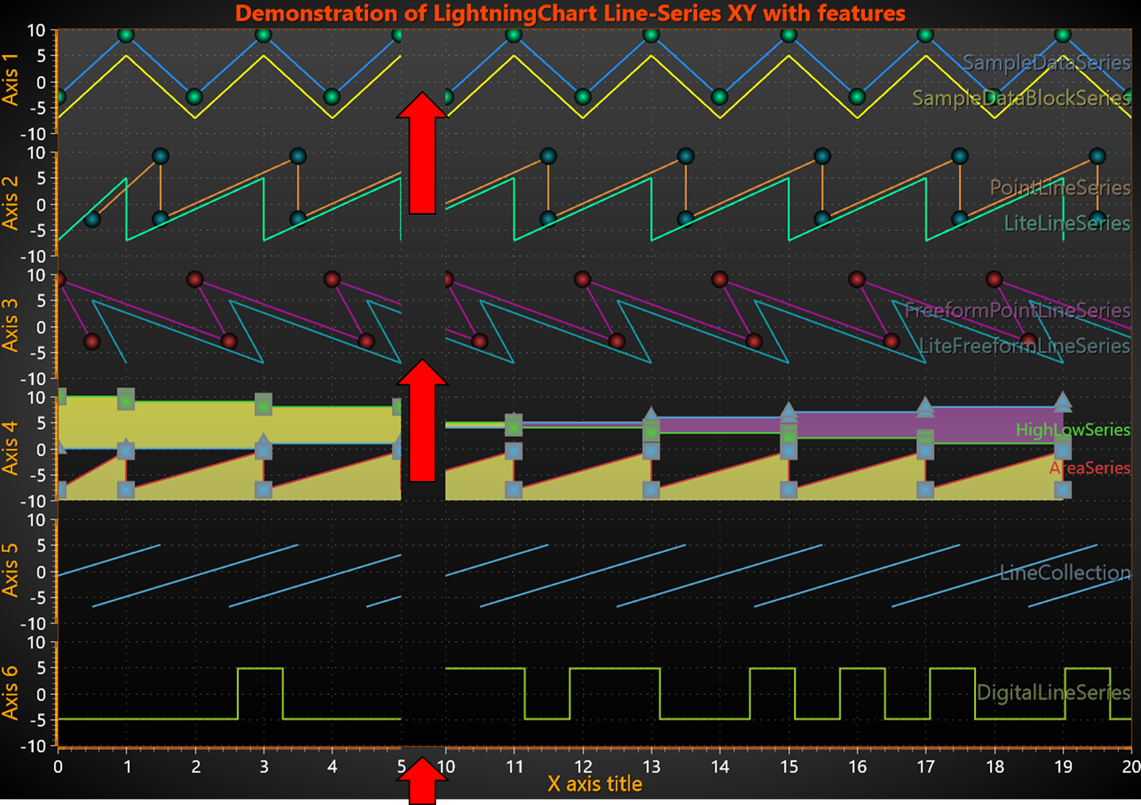
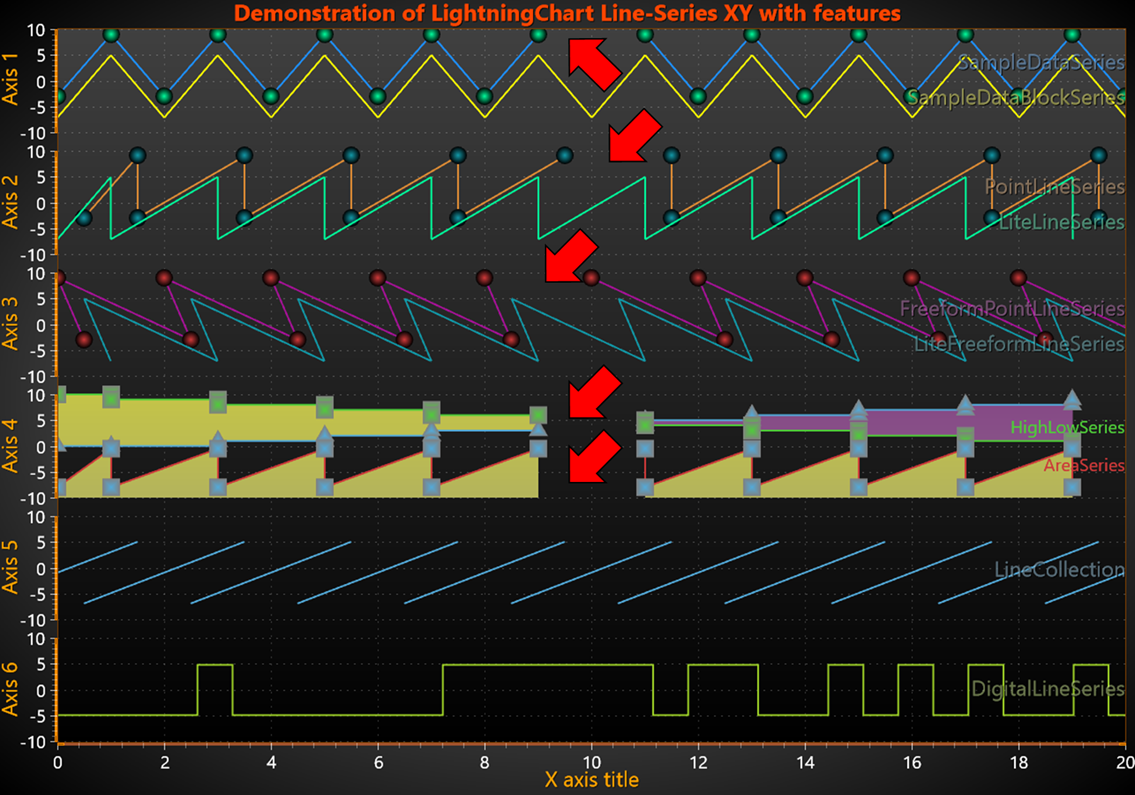
When assumption of fixed interval progressive X-Value order is met, user should use SampleDataBlockSeries or SampleDataSeries, because those are the fastest series and use less memory. However, if data is progressive but not at fixed interval (Points[i+1].X ≥ Points[i].X), then user should choose second best (performing series) - LiteLineSeries or PointLineSeries. Other series, which require at least progressive X-Value order are AreaSeries, HighLowSeries and DigitalLineSeries.
Only series which does not have assumption about point order are LiteFreeformLineSeries, FreeformPointLineSeries and LineCollection. Those Series allow drawing line point to any direction from previous point. However, those series will have reduced performance as compared to other line series (with more strict assumptions).
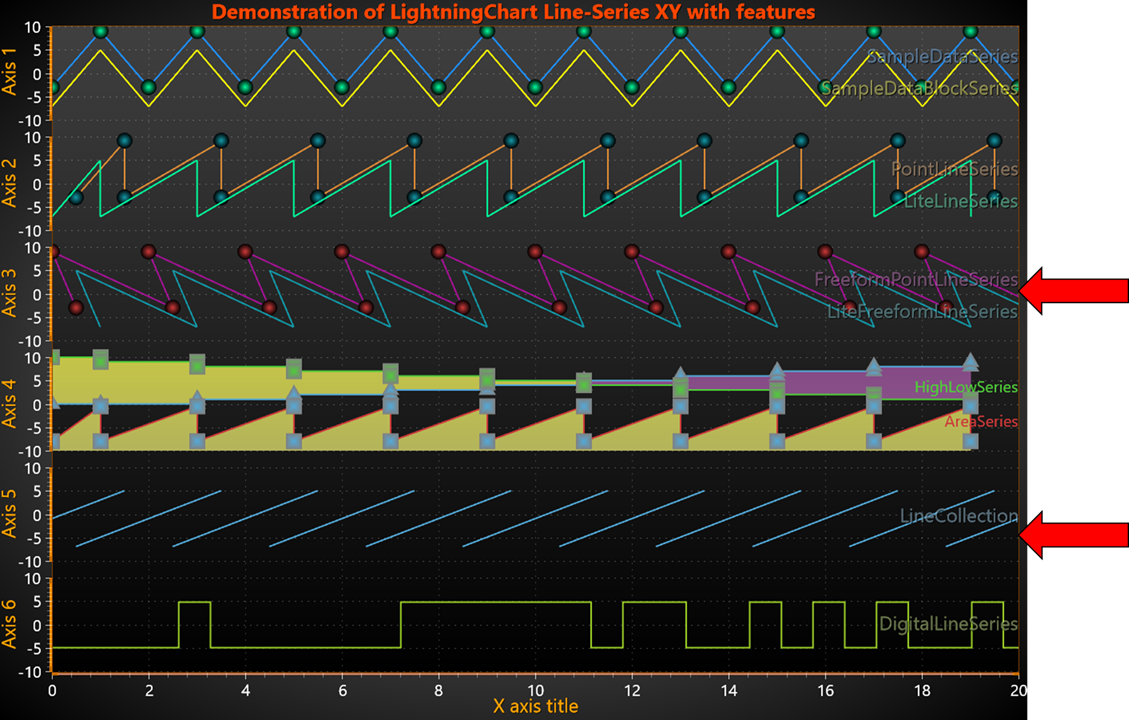
Only 3 series don’t have progressive x-value requirement/assumption (arrow).
Optimized memory and GC usage
In general, LightningChart performance is excellent for all series. Especially if point count is low (e.g. less than 1000 points). If user is building very demanding real-time application with millions/billions points to visualize, this feature (optimized memory and .NET garbage collector (GC) usage) becomes critical. More and more data are generated every day, and hence more points should be handled by user application. This puts a lot of pressure on memory and GC. To address this issue (i.e., lower the pressure) we added several new series relatively recently. SampleDataBlockSeries was added in library version 10.1, LiteLineSeries, LiteFreeformLineSeries and DigitalLineSeries was added in 10.3. The first three is counterpart to older series: SampleDataSeries, PointLineSeries, FreeformPointLineSeries. New series could handle (chart could render) at least 10 times more points with same RAM usage and smoothness of sweeping/scrolling of X-axis. The tradeoff for greatly improved performance (especially for more than million points) is reduced number of features supported by new series (see table above).
Points Visible feature
While line connecting two data points could be drawn for all line-series types (controlled by LineVisible or Visible properties), only half of series could draw symbol/point. Series which could draw symbol/point (controlled by PointsVisible property) are SampleDataSeries, PointLineSeries, FreeformPointLineSeries, AreaSeries and HighLowSeries. Alter the point style by setting PointStyle (or PointStyleHigh or PointStyleLow) properties. Select the shape from many pre-defined styles from PointStyle.Shape. One of the shape styles is Bitmap, which allows drawing any bitmap image in the point location.
Coloring points individually
Starting from v.7.2, the PointLineSeries, FreeformPointLineSeries, AreaSeries and HighLowSeries have PointColor field in the data point structures. To enable individual point coloring, set IndividualPointColoring to Color1, Color2, Color3 or BorderColor setting. To disable individual point coloring, set IndividualPointColoring = Off. The color options settings correspond to that color-properties in PointStyle property tree.
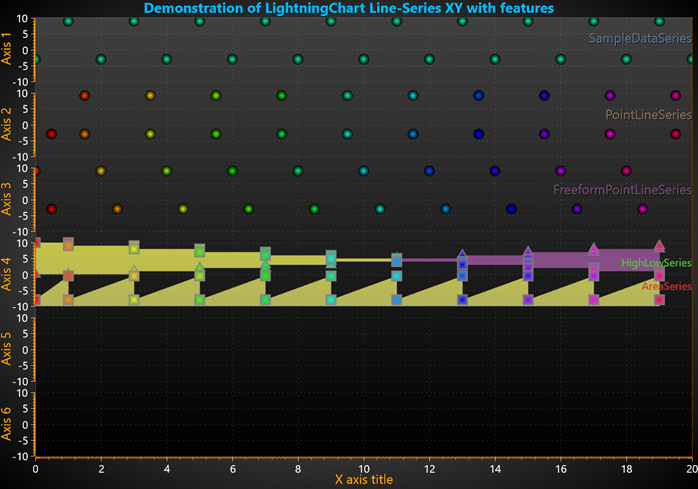
Only PointLineSeries, FreeformPointLineSeries, AreaSeries and HighLowSeries could have point-symbol. And those points could have individually color. SampleDataSeries could show points, but they all same style.
Y-value precision
Only SampleDataBlockSeries, SampleDataSeries support single precision sample Y values. While for SampleDataBlockSeries it is only option, the SampleDataSeries supports single and double precision. Using single precision values is recommended when keeping the memory reserving as low as possible. Select the sample format with SampleFormat property. Note, that SampleDataSeries has 2 separate properties/array to keep different precision data (SamplesSingle and SamplesDouble respectively).
Y-value based coloring of line or fill
By enabling UsePalette property of SampleDataSeries, PointLineSeries, FreeformPointLineSeries, AreaSeries or HighLowSeries the coloring of line (or Fill for the last two) is applied by the ValueRangePalette property. ValueRangePalette contains Y value and color pairs. ValueRangePalette.Type sets the Gradient or Uniform steps palette (see Y-value based coloring of Line and Fill).
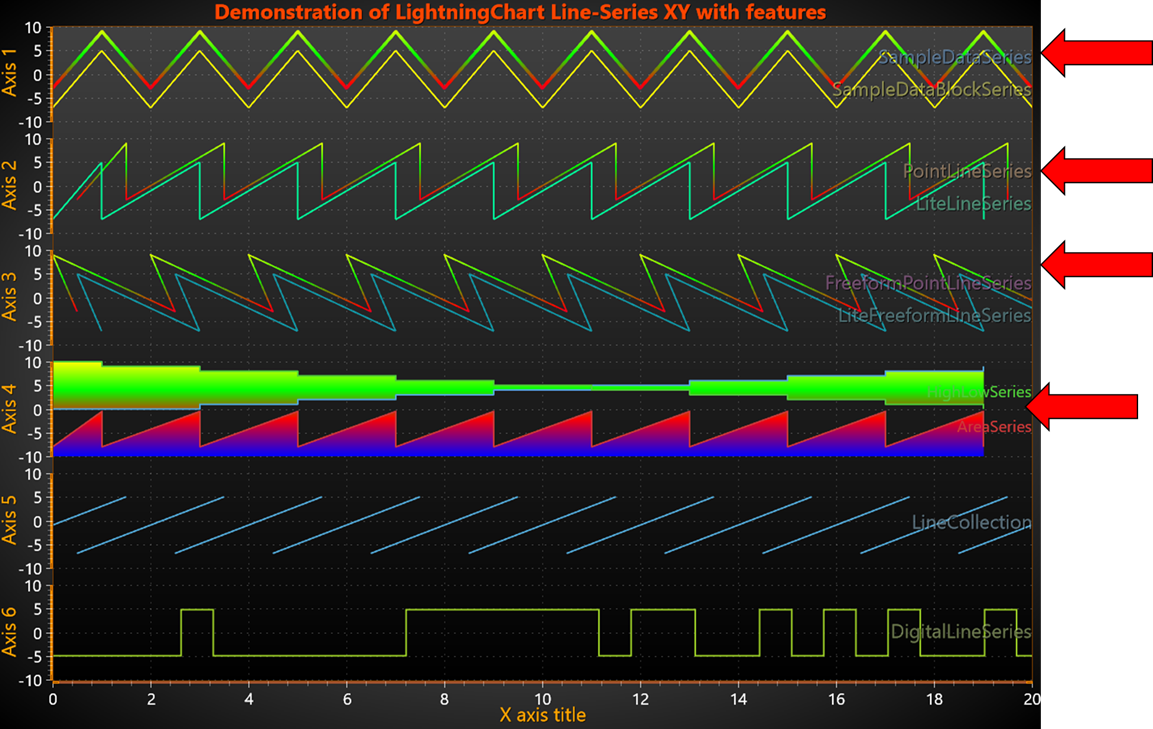
Only SampleDataSeries, PointLineSeries, FreeformPointLineSeries, AreaSeries or HighLowSeries could be colorized with ValueRangePalette (Y-value based color)
CustomLinePointColoringAndShaping event
Custom coloring and coordinate adjustment can be made with CustomLinePointColoringAndShaping event, which is called just before entering the rendering stage of the chart. Customized coloring and coordinate adjustment could be done only for SampleDataSeries, PointLineSeries and FreeformPointLineSeries (see Custom shaping and coloring).
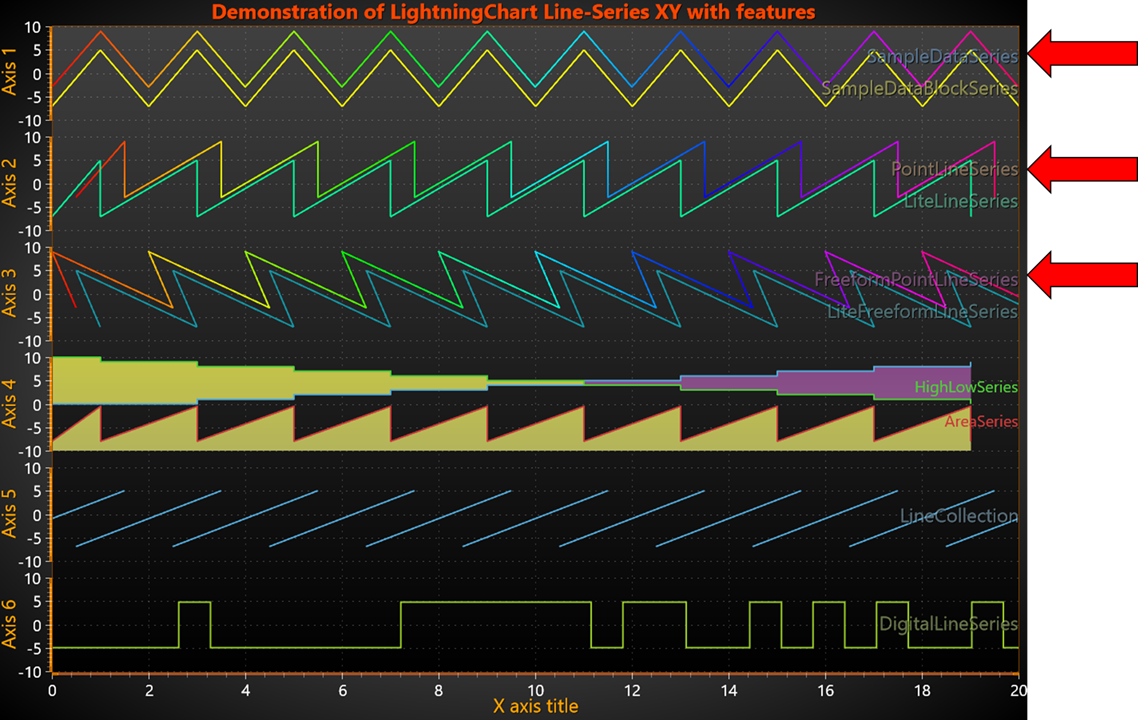
Only SampleDataSeries, PointLineSeries or FreeformPointLineSeries could have CustomLinePointColoringAndShaping event handler, where be color and color could be modified before final rendering.
XAxis ScaleBreaks
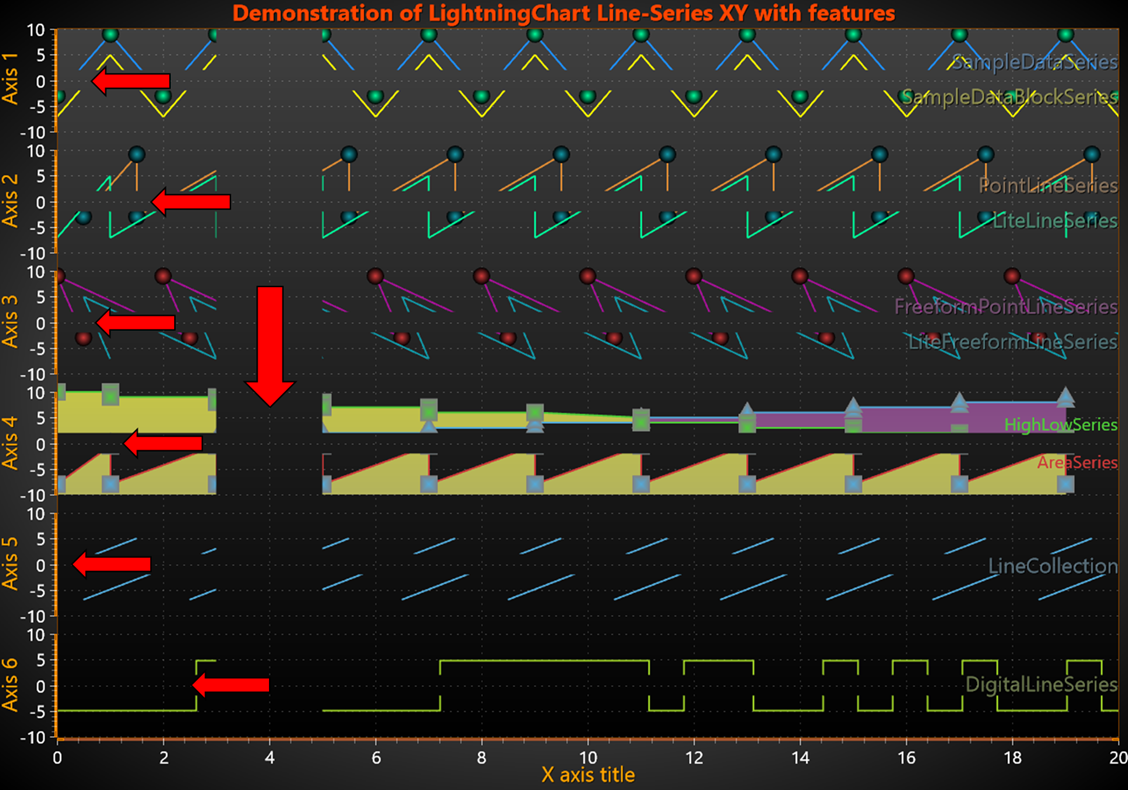
ScaleBreaks allow excluding specific X ranges. For example, inactive trading hours/dates or machinery off-production hours. All the series, that have been assigned to the specified X axis, are clipped, including axis and labels themselves.
There are limitations of when ScaleBreaks can be used: ScrollMode must be set to ‘None’ and ScaleType to ‘Linear’. Specify the range of the break with Begin and End. They are given as axis values, not DateTimes. Use axis. DateTimeToAxisValue method to convert them if using DateTimes. Gap style could be configured. PointLineSeries, AreaSeries and HighLowSeries have ContinuousOverScaleBreak property. By enabling it, a connecting line will be rendered over the gap. (for more information see X Axis specific properties).
ScaleBreaks allow excluding specific X ranges (here 5-10). All the series, that have been assigned to the specified X axis, are clipped, including axis and labels themselves.
DataBreaking by NaN or other value
LightningChart skips rendering of the data points that match with specified breaking Value. All other values it renders normally. Only PointLineSeriesBase class series support data breaking: SampleDataSeries, PointLineSeries, FreeformPointLineSeries, AreaSeries or HighLowSeries. Feature is enabled by enabling Series. DataBreaking. Enabled property and setting desired value (Series. DataBreaking. Value default NaN) (see DataBreaking by NaN or other value).
When DataBreaking.Enabled = True, it will cause significant extra overhead, and is not recommended for solutions needing a very high real-time data rates. Consider using ClipAreas instead.
DataBreaking by NaN or other value. SampleDataSeries, PointLineSeries, FreeformPointLineSeries, AreaSeries or HighLowSeries may have specific value (X or Y), which indicated that line rendering should be broken (point/segment ignored).
ClipAreas
Like DataBreaking, ClipAreas can be used to prevent part of the series data from rendering. They can be used to filter out bad data ranges, out-of-range data by Y value, etc. The ClipArea applies for the series (applicable for all XY series) that it has been assigned to. Note that this is a rendering-stage clipping and mouse operations will respond to series when placed over the ClipArea if there's actual data under it. Using ClipAreas is the performance-wise preferred way to break a line to several data segments instead of using DataBreaking feature. (see ClipAreas).
ClipAreas can be used to prevent part of the series data from rendering. Here ‘clip band’ between XAxis 5 and between YAxis 2. Clipping is applied for all series.
Tracking Y-value with LineSeriesCursors
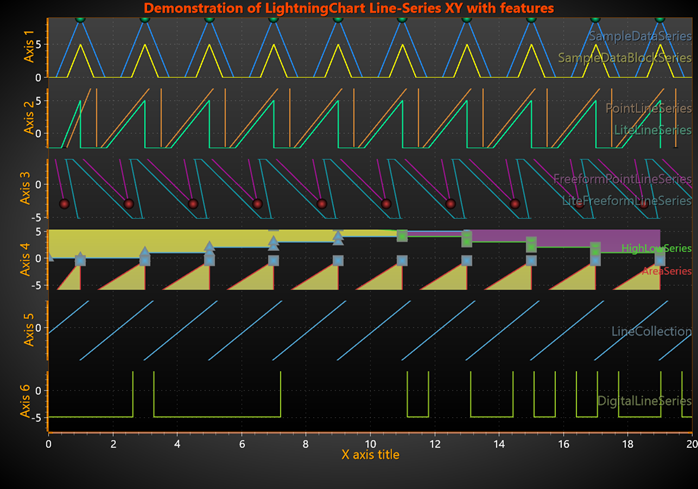
Line series cursors allow tracking of many line-series at once by tracking the Y-values at X coordinate. Series values can only be resolved with series implementing ITrackable interface (SampleDataSeries, SampleDataBlockSeries, PointLineSeries, LiteLineSeries, DigitalLineSeries, AreaSeries, HighLowSeries).
LineSeriesCursors, can snap-to-points or show interpolated value (SnapToPoints property). In addition, it has several styles: PointTracking (configurable shape and size of tracking point), HairCrossTracking (thick and thin-hair, coloring mixing etc.) and VerticalNoTracking (no tracking point or line just vertical line). (see LineSeriesCursors).
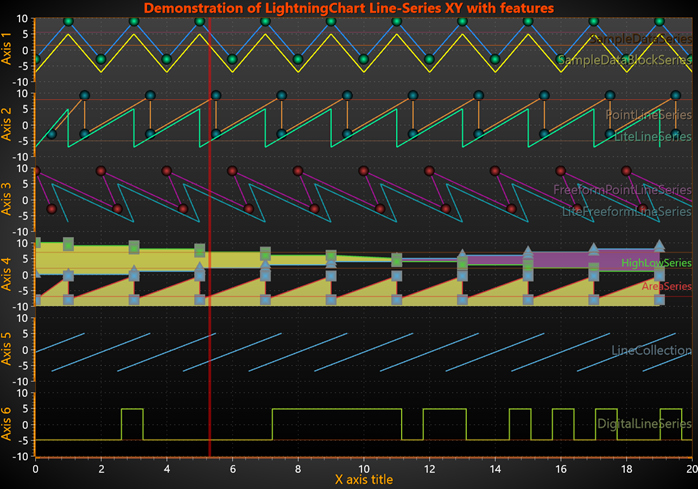
LineSeriesCursor tracks the Y-values at X coordinate for all ‘progressive’ line-series (all but LiteFreeformLineSeries, FreeformPointLineSeries and LineCollection). Here is HairCrossTracking style is shown, although various style markers could be used instead.
Tracking with DataCursor
Starting from v10.4 new type of DataCursor is added. DataCursor tracks all XY series, including line-series discussed here. It finds closest data point to mouse-cursor and show it X-Y values, series title and other relevant information in ‘Result table’. ‘Hair Cross’ lines (vertical and horizontal) could be shown. ‘Labels’ with point’s x/y value are shown on the axis Series is assigned to. The style and visibility of each DataCursor item (‘Tracking Point’, ‘Result table’, ‘Hair Cross’, ‘Labels’) could be configured. ‘Result table’ header and ‘Labels’ box fill’s color is defined by line-series color, bar-series color or heatmap pixel color. ‘Result table’ text color is defined by series title color. (see DataCursor).
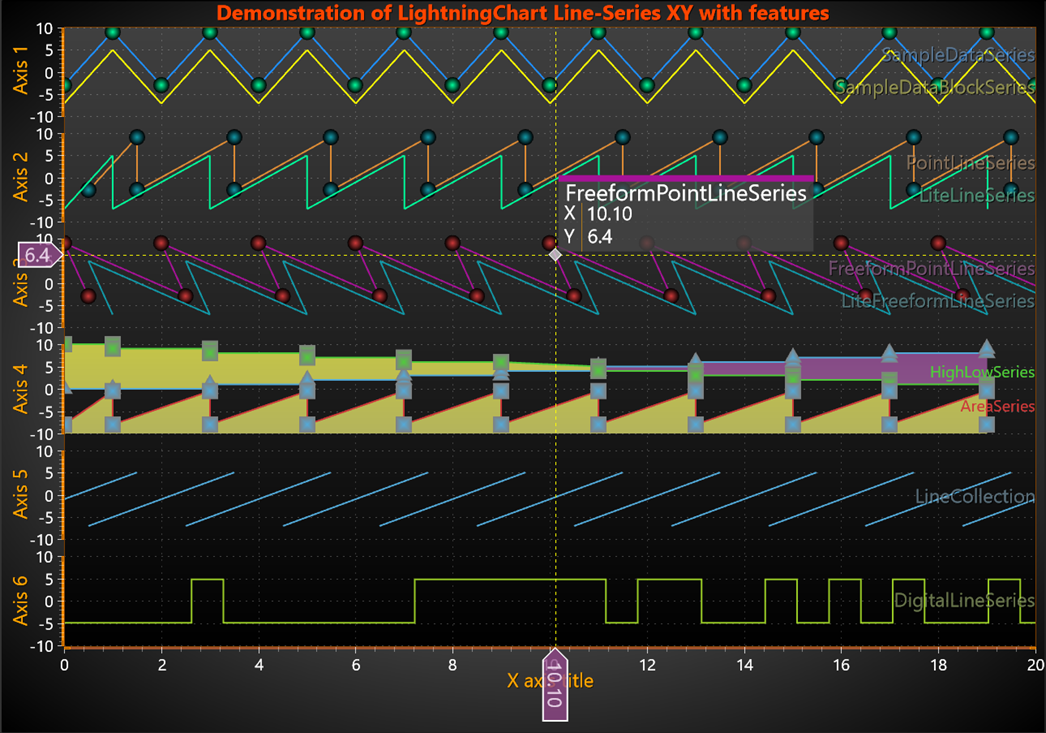
Data points of all series could be tracked with DataCursor. Series title, point color and values of closest point to mouse-cursor is shown.
Polynomial regression
Only PointLineSeries has properties/feature to do regression fitting for data points. Regression fitting, utilizing RegressionFitting and RegressionPolyOrder properties of PointLineSeries. When RegressionFitting is set other than None option, line and points replaced with fitted curve.
For other series it is possible to use MathRoutines.PolynomialRegression() method and replace data with fitted points.
Limit Y-value To Stack Segment
Each XY series has boolean LimitYToStackSegment property. This limits Y draw range to segment area when y-axes are stacked. For most of XY series, if property is enabled simple clipping of data is done. However, newer series (SampleDataBlockSeries, LiteLineSeries and LiteFreeformLineSeries) has additional options. There LimitYToSegment is enumerated type: None, Clip (line will be clipped as for old series) and ClampToSegment (if line exceeds segment’s edge, it will be rendered horizontally on y-axis edge). Note, LiteFreeformLineSeries ClampToSegment line will be rendered along the edge as far as the real point x-value would be, therefore, may be longer than other series clamping line. (see LimitYToStackSegment).
When series has Boolean LimitYToStackSegment property is enabled, y-value is clipped at minimum and maximum. Applicable for all XY series.
Automatic Series title placement
Each XY series has title (by default hidden), for which style and position could be modified through properties. User could enable ViewXY. TitlesAutoPlacement. Enabled, which inform chart that Series’ Title location should be calculated in order to avoid multiple titles overlap. Title position could be locked (at current X-Y value) by enabling series. Title. LockAutoPosition property. Auto positioning is reset with ViewXY. TitlesAutoPlacement. Reset() method.
Line Style (pattern)
All (10) line-series could render line (between 2 or more points). However, line styling is very limited for SampleDataBlockSeries, LiteLineSeries, LiteFreeformLineSeries and DigitalLineSeries, as those series has only Color and Width properties, while pattern can only be Solid.
In contrast, other series support LineStyle fully. Those are SampleDataSeries, PointLineSeries, FreeformPointLineSeries, AreaSeries, HighLowSeries and LineCollection.
Rendering data into the Persistent-Rendering-Layer
Either PersistentSeriesRenderingLayer or PersistentSeriesRenderingIntensityLayer can be created.
Persistent-Rendering-Layer can be used for extremely fast rendering of repetitive line/points data, or line/points/high-low/area fill data, which is plotted in same X and Y range over and over again.
Render the data into the (bitmap kind of) layer by using any of PointLineSeries, SampleDataSeries, FreeformPointLineSeries, HighLowSeries or AreaSeries objects (all belong to PointLineSeriesBase class).
To see feature demonstration as example, check LineSeriesXYFeatures from our Demo.