Data cursors (DataCursor)
Starting from version 10.4, ViewXY has a built-in data cursor, which automatically tracks the closest series value to the mouse cursor and shows it in a result table. The cursor consists of horizontal and vertical hair cross lines, tracking point at the location of the closest data value, axis labels showing the current X- and Y-values, and the result table, which besides the axis values also shows the series name and its color.
Basic properties
Data cursor can be enabled or disabled via Visible property. It is also possible to hide some of the cursor components such as the lines or the axis labels individually by setting ShowHaircrossLines or ShowLabels, or other respective “Show” properties based on what should be hidden, false. The appearance of the cursor can also be modified via component specific properties. LabelFont modifies the axis label texts, LineStyle can be used to customize the hair cross lines, and TrackingPointStyle allows altering the tracking point. Results property contains all the options to modify the result table.
// Enables data cursor but hides its axis labels.
_chart.ViewXY.DataCursor.Visible = true;
_chart.ViewXY.DataCursor.ShowLabels = false;
// Modifying result table.
_chart.ViewXY.DataCursor.Results.Background.Color = Colors.DarkBlue;

Property tree of the data cursor.
In version 12.0.1 some of DataCursor properties at ViewPolar & ViewSmith has been renamed, while other replaced with more specific properties. More about those API changes can be found here
From version 12.0.1 DataCursor for all views (XY, 3D, Polar or Smith) has Configuration property tree. There user can find properties to control color, style and visibility of label for each axis independently. The default text color is Series.Title.Color, default label's fill color is tracked pixel color and default label's border color is white.

Data cursor has been enabled. No individual components have been hidden.

Data cursor tracking an Intenstiy Grid. Besides X- and Y-values the cursor shows the grid’s Value and Color fields.
Data cursor changes its behavior depending on whether the tracked series has a visible line or just visible data points (scatter plot). If the line is visible, the cursor finds the nearest series and its value vertically in the cursor’s current X-position. If there are no lines visible, the cursor tracks the nearest data point in any direction. Enabling SnapToNearestDataPoint overrides this making the cursor always finding the nearest actual data point value in any direction.
DataCursor in real-time/streaming applications
It should be noted that using data cursor in demanding real-time applications can decrease the performance significantly since the cursor is constantly calculating the nearest data value. To counter this, the cursor has RealTimeTracking property, which when enabled increases the overall performance. The drawback is that the cursor is updated less frequently and may seem laggy especially when the mouse is moved around scrolling or sweeping chart.
Cursor tracking per Series
Series has CursorTrackEnabled property, which controls whatever it is being tracked by DataCursor or LineSeriesCursor. User can disable this property if particular series tracking is not needed.
Customizable content of ResultTable
From version 12.4 onwards, DataCursor can have customizable content of ResultTable. In particular, after subscribing to DataCursor. ChangeResultContent event, user can use event handler to create a composite format string, which will be used instead of the default table. As much as composite format string allows, user can define which values to show in the ResultTable, with what precision and how to arrange items (e.g. padding, alignment, multi-lines).
ChangeResultContent event is available for XY, 3D, Polar and Smith views, although event-argument-class is slightly different for each. The event-argument gives user access to tracked series, axis values of tacking point and few other parameters.
When creating customized table, ResultContent should be set like in following example:
// subscribing to event
_chart.ViewPolar.DataCursor.ChangeResultContent += DataCursor_ChangeResultContent;


// DataCursor event handler
private void DataCursor_ChangeResultContent(object sender, ViewPolarDataCursorResultTableFormatEventArgs e)
{
    // ...

    // For multi-line string it is better to use monospaced fonts for nice alignments.
    // Following composite format string titles to the left and values to the right,
    // Each with preferred formatted field width.
    string formatString =
		"{0}\n" +
		"    {1,-12}{2,8:0.00} {3}\n" +
		"    {4,-12}{5,8:0.00} {6}";

    // ...

    e.ResultContent = string.Format(formatString,
    strSeriesTitle,
    strAngleTitle, angle, strAngleUnits,
    strAmplitudeTitle, amplitude, strAmplitudeUnits);
}
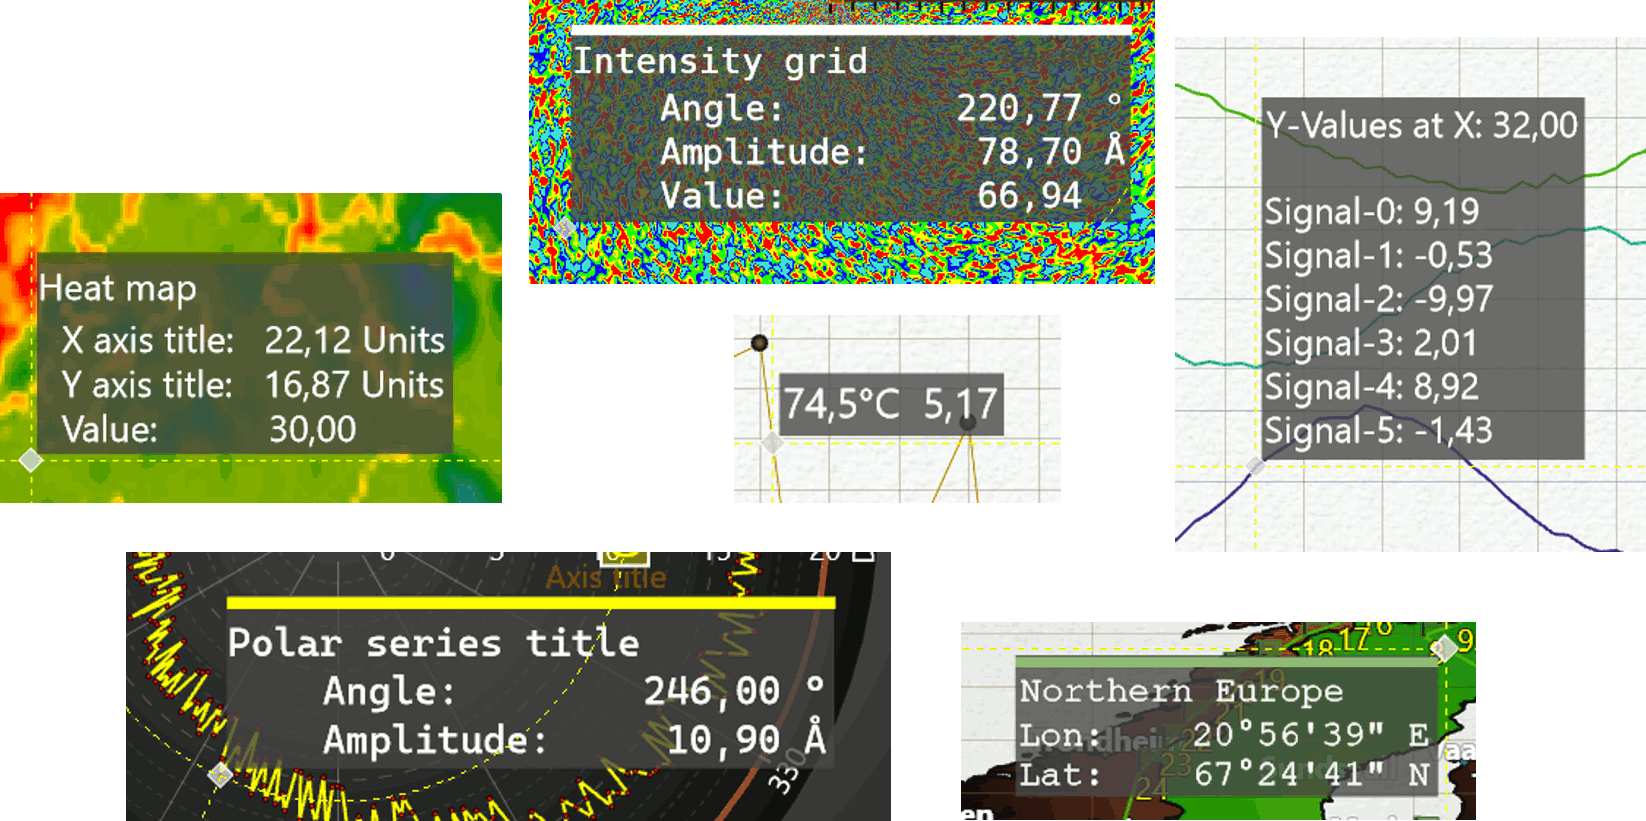
Examples of customized ResultTable.
More examples how customizable content of ResultTable can be created is found in How-to guides.