EventMarkers in ViewXY
EventMarkers allow marking a point of interest, where something special occurred during real-time monitoring, or if user just wants to mark a piece of data with a special annotation. Define the marker symbol with Symbol property and a text label with Label property.
Like Annotations, EventMarkers can be dragged with mouse-cursor (when AllowDragging is enabled). It is also possible to create various event handlers for interactions (when AllowUserInteraction is enabled). For example, custom handler for MouseClick event.
Adjusting appearance
To select the shape of the marker, set Symbol. Shape. Shapes available for all type of EventMarkers are Rectangle, Circle, Triangle, Hexagon, Flag, FlagLightning, Cross, CrossAim, Bitmap, HollowBasic, HollowBasicActive, HollowHarmonic, HollowActiveSideband, HollowSideband, HollowTailedActive and HollowTailed. Symbol properties Angle, Height, Width, Color1-2-3, GradientFill can further be used to modify appearance of Marker.
Label property has many sub-properties to modify visibility, text, font, fill, angle and alignment relative to symbol (Visible, Text, Font, Fill, Angle, HorizontalAlign, VerticalAlign, Distance respectively).
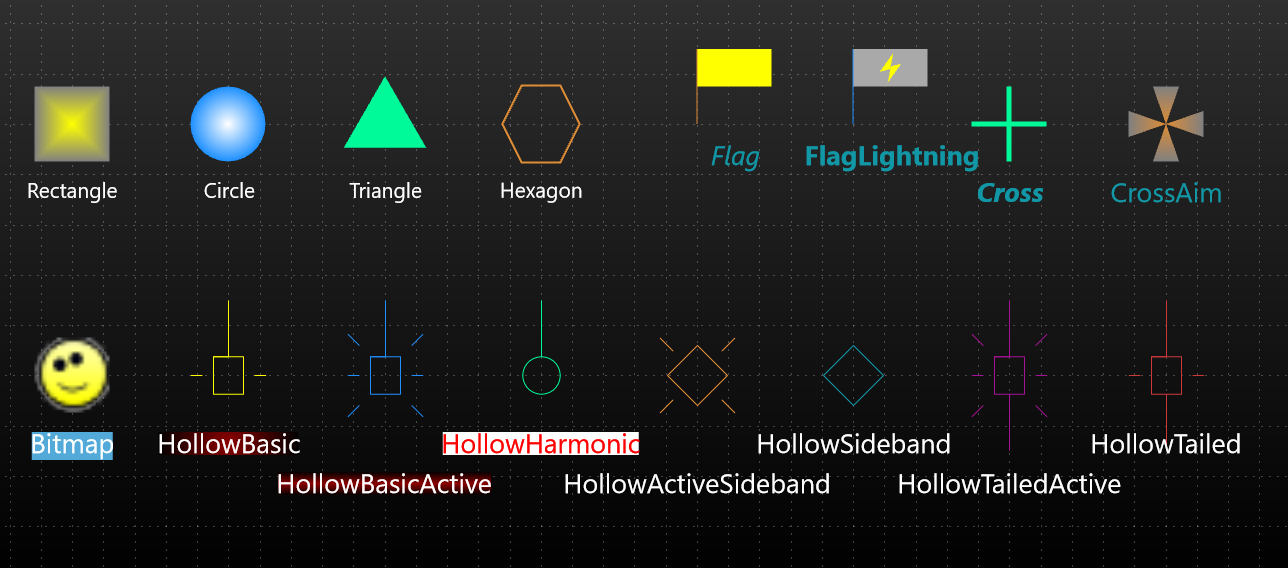
Various styles of EventMarker for Symbol and Label.
One of the shape styles is Bitmap, which allows drawing any bitmap image in the point location. Define the bitmap image with BitmapImage property. BitmapAlphaLevel property can be used to alter the transparency of the bitmap. Adjust the bitmap color tone by changing BitmapImageTintColor to some other color than white. If UseImageSize property is enabled, then image original size is used instead of PointStyle properties Height and Width.
EventMarker's Symbol properties and shapes are very similar to PointStyle of line-series .
While ChartEventMarker and SeriesEventMarker similar in many respects, the main difference comes how those two objects positioned in the chart (how vertical and horizontal position are defined).
Chart event markers
ViewXY. ChartEventMarkers collection allows adding chart markers. A chart marker can be used to indicate a point of interest, like “Test person stood up”, “Capacitor bypassed”. Unlike series event markers, chart event markers are not attached to a specific series. The markers can be dragged with mouse into another location.
The position of a chart marker can be set via VerticalPosition, XValue, BindToXAxis and Offset properties.
The vertical position of ChartEventMarker is controlled by VerticalPosition property, which has Top, GraphTop, GraphCenter, GraphBottom and Bottom options. Furthermore, Offset.Y property can further fine adjust vertical location (Offset is in screen-coordinates, px).
For setting horizontal position of ChartEventMarker users can use either screen-coordinates or XAxis value. If BindToXAxis property set true, then marker binds to a specific X-axis, and to specific XValue. In practice, this makes the marker stay at its current X-value and move when, for example, the X-axis is panned. When BindToXAxis is disabled, the marker is kept in the same chart position no matter how the axes are moved (position is defined by Offset.X property, which offset in screen-coordinates from the left edge). If there are several X axes, AssignXAxisIndex can be used to set which axis the marker is bound to.
ClipInsideXRange can be used with or without BindToXAxis enabled. It makes a marker to clip when a specific X-axis value (it is bound to) is not within the visible X-axis range. There is also ClipInsideGraph property, which determines if a chart marker can be drawn outside the graph area (on the margins).
Line series event markers
Line-series have SeriesEventMarkers collection property. It can be used to assign series specific event markers. The series event markers can be dragged with mouse to another location, while keeping the event marker attached to the series values. To enable this, marker’s VerticalPosition must be set to TrackSeries (see ExampleMarkersTracking for demonstration). This is available for series implementing ITrackable interface.
Other SeriesEventMarker. VerticalPosition options are AtYValue, ZeroLevel, YAxisTop, YAxisCenter and YAxisBottom.
By setting HorizontalPosition to SnapToPoints, the marker aligns itself horizontally to position of nearest data point. HorizontalPosition = AtXValue allows placing the marker at any x value. Respectively, VerticalPosition = AtYValue allows setting the marker vertically to any Y level.
No line-series data point is required, if user wants just to set Marker at specific axes-coordinates, one should set XValue and YValue properties (together with HorizontalPosition = AtXValue and VerticalPosition = AtYValue).
In addition to normal set of shapes, SeriesEventMarker supports two special Symbol. Shape settings, HollowYAxis and HollowYAxisActive, which allow vertical line with Y axis ticks projection. They have a pixel wide vertical line which picks positions of MajorTicks and MinorTicks from the Y axis the series is attached to. To adjust the tick lengths, edit YAxis. MajorDivTickStyle. LineLength and YAxis. MinorDivTickStyle. LineLength properties.

Two special SeriesEventMarkers shapes: HollowYAxis and HollowYAxisActive. Very handy when making per-series data cursors.
To see EventMarkers used in example, check ExampleTradingMultiSegment, ExampleMarkersTracking, ExampleMapRoute, ExampleHeatmapColorSpreading2D, Bubble chart, Campbell diagram, Curve node editing from our Demo.