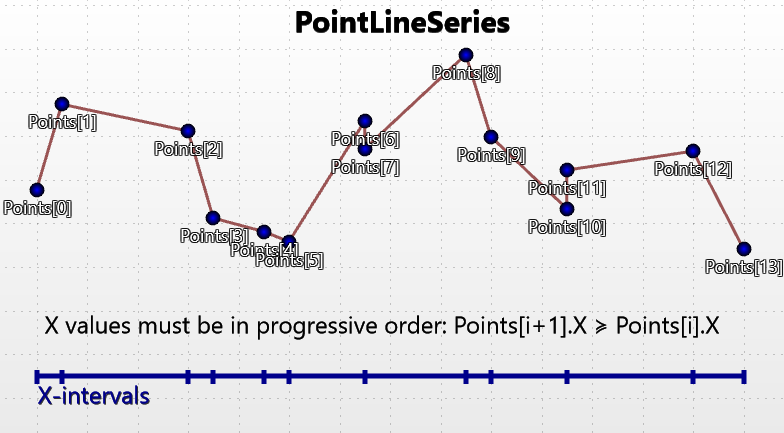
PointLineSeries
A PointLineSeries can present a simple line, points(scatter) or both as a point line. PointLineSeries is good for variable interval progressing data. That is, X values must be in progressive order:
Points[i+1].X ≥ Points[i].X.
Note, PointLineSeries is not the fastest line-series (for real-time streaming application). Series which requires fixed interval progressive data (like SampleDataBlockSeries or SampleDataSeries) is faster than PointLineSeries. Also LiteLineSeries is faster than PointLineSeries, but don't have point-shapes and some other features. See more Line-series comparison.
Overview of PointLineSeries.
Add the series to chart by adding PointLineSeries objects to PointLineSeries list.
chart.ViewXY.PointLineSeries.Add(series); // Add series to the chart
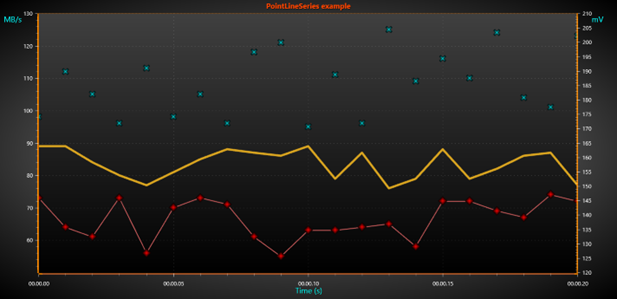
Three different PointLineSeries (only LineVisible, only PointsVisible and both)
Line style
Series support LineStyle.
All line series can render a line (between 2 or more points). The series have properties controlling color and width of the line under LineStyle class. If the line should not be visible, set LineVisible = false. In addition to those properties, line pattern also can be modified. Available options include Solid, Dot, Dash, DashDot and SmallDot. PatternScale property can be used to modify the length of each dash or dot.
Points style
Series support PointStyle.
To show the points, set PointsVisible = true. Alter the point style by setting PointStyle properties. Select the shape from many pre-defined styles from PointStyle.Shape. When using pre-defined point styles, like Circle, Triangle, Cross etc. the drawing colors and filling styles can be defined. Note that all colors or fills are not applicable for all shape styles. Point width and height can be set and the points can be rotated as well.
One of the shape styles is Bitmap, which allows drawing any bitmap image in the point location. Define the bitmap image with BitmapImage property. BitmapAlphaLevel property can be used to alter the transparency of the bitmap. Adjust the bitmap color tone by changing BitmapImageTintColor to some other color than white.
Adding points
The series points must be added in code. Use AddPoints(SeriesPoint[], bool invalidate) method to add points to the end of existing points.
//Add points to the end
chart.ViewXY.PointLineSeries[0].AddPoints(pointsArray);
To set whole series data at once, and overwrite old points, assign the new point array directly:
//Assign the points array
chart.ViewXY.PointLineSeries[0].Points = pointsArray;
The PointLineSeries points X values must be in ascending order. If they have to be otherwise ordered, use FreeformPointLineSeries instead.
For example, definition Points[0].X = 0, Points[1].X = 5, Points[2].X = 5, Points[3].X = 6 is valid.
But Points[0].X = 2, Points[1].X =1, Points[2].X = 6, Points[3].X =7 is not a valid value array for PointLineSeries.
Adding points, alternative way
Points can also be added in X and Y values arrays, which turns to be more convenient way in many applications.
chart.ViewXY.PointLineSeries[0].AddPoints(xValuesArray,yValuesArray,false);
To set whole series data at once, and overwrite old points, assign the X and Y values arrays directly (applicable in WinForms and WPF Non-bindable APIs).
chart.ViewXY.PointLineSeries[0].SetValues(xValuesArray, yValuesArray);
SeriesEventMarker
Series support SeriesEventMarker.
Coloring points individually
Series support IndividualPointColoring.
Y-value based coloring
Series support UsePalette and Y-value based coloring
Custom shaping and coloring
Series support CustomLinePointColoringAndShaping event.
Polynomial regression
Series support regression fitting for data points.
DataBreaking
Series support DataBreaking by NaN or other value.
ClipAreas
Series support ClipAreas.
LineSeriesCursors
Series can be tracked with LineSeriesCursors.
DataCursor
Series can be tracked with DataCursor.
LimitYToStackSegment
Series support LimitYToStackSegment.
Rendering data into the Persistent-Rendering-Layer
Series data can be added to either PersistentSeriesRenderingLayer or PersistentSeriesRenderingIntensityLayer.
Examples
To see feature demonstration as example, check LineSeriesXYFeatures, MultiColorLineEvent, MarkersTracking and Regression fit from our Demo.