


WPF Chart Control
LightningChart for WPF offers a wide range of user interface options for your Windows applications through the WPF Chart Control. With the LightningChart toolbox integrated into Microsoft Visual Studio, it has never been easier to implement and configure your application’s WPF charts and user control.
With the custom DirectX rendering methods and all-around optimization, LightningChart’s WPF chart control offers an exceptional performance faster than any other solution in the market.
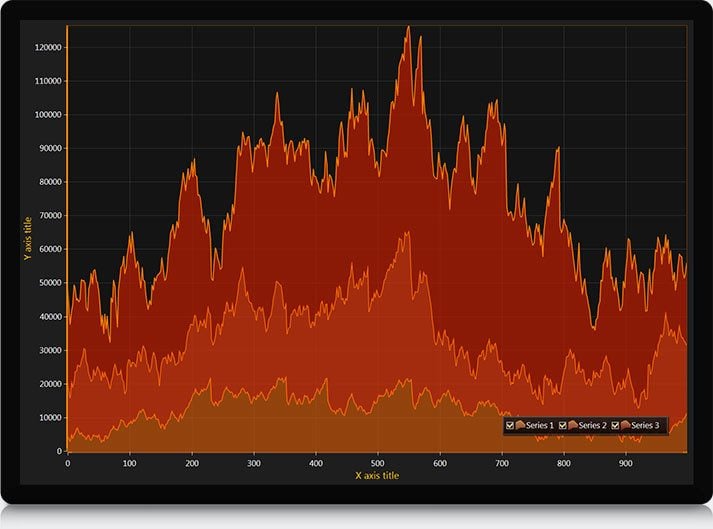
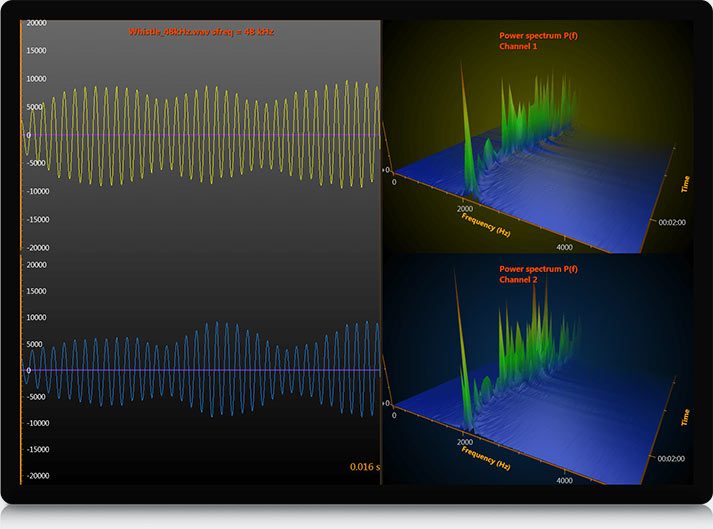
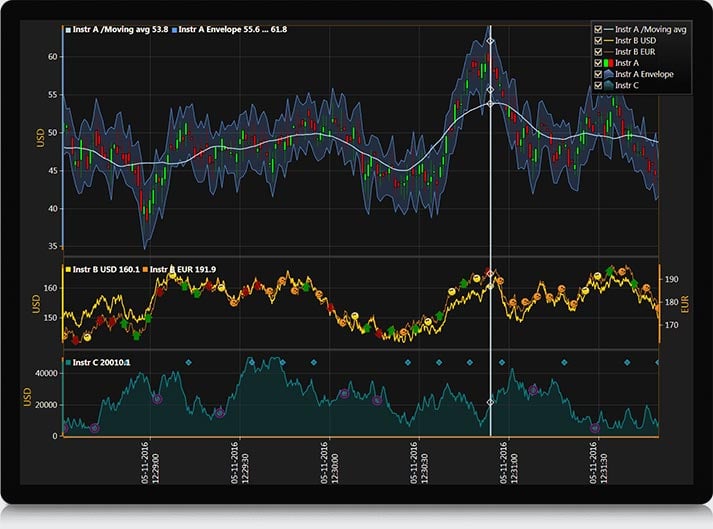
Built with the rendering speed and overall performance in mind, LightningChart features a multitude of tools to present graphical information in the most customized and descriptive way for any particular solution: line, scatter, bar, area, and contour charts, as well as 3D, polar and candle-stick trading charts, which are just a few examples of all the chart control instruments supplied with LightningChart WPF.
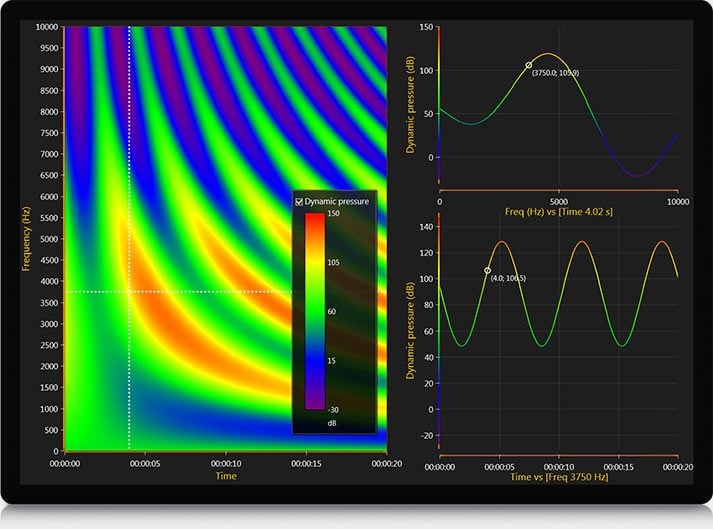
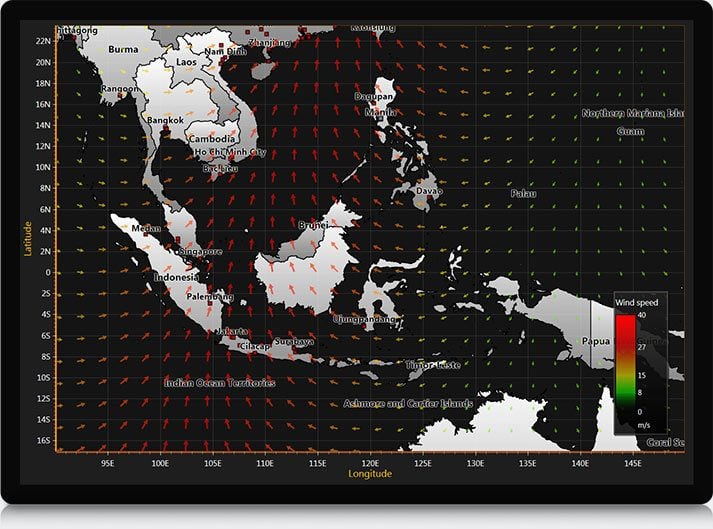
The performance and robustness of LightningChart make it a perfect choice as a charting SDK. The extent of solutions developed with LightningChart WPF chart control range from financial and business dashboards to engineering and scientific data visualization applications, featuring complex 3D scenes with millions of polygons and dynamic lighting features.
LightningChart Features:
- Massive dataset rendering support
- Online and offline maps out of the box
- Full GPU acceleration
- Premium quality customer service and support
- Superior 2D and 3D rendering performance
- Full touch compatibility
- Audio I/O components included
LightningChart .NET
Do you need advanced .NET data visualization components? Take a look at LightningChart .NET charts, the fastest and most advanced WPF, UWP & WinForms data visualization toolkit ever made.


If you have any questions, feel free to contact us!
©LightningChart Ltd 2026. All rights reserved.