




LightningChart .NET v.12.2.1 is out now!
.NET target framework 8.0, improved HERE maps, MeshModel performance, and more.
New .NET Target Framework
LightningChart .NET has been updated from version 6.0 to 8.0. This change ensures native support for the LightningChart control within .NET projects and aligns with Microsoft’s support policy for the .NET framework.
LightningChart v12.2.1, compiled for .NET 8.0, is compatible with .NET projects 8.0, 9.0, and 10.0. Additionally, a separate library build is available for projects utilizing .NET Framework 4.8 and later versions.

HERE map rendering services upgrade
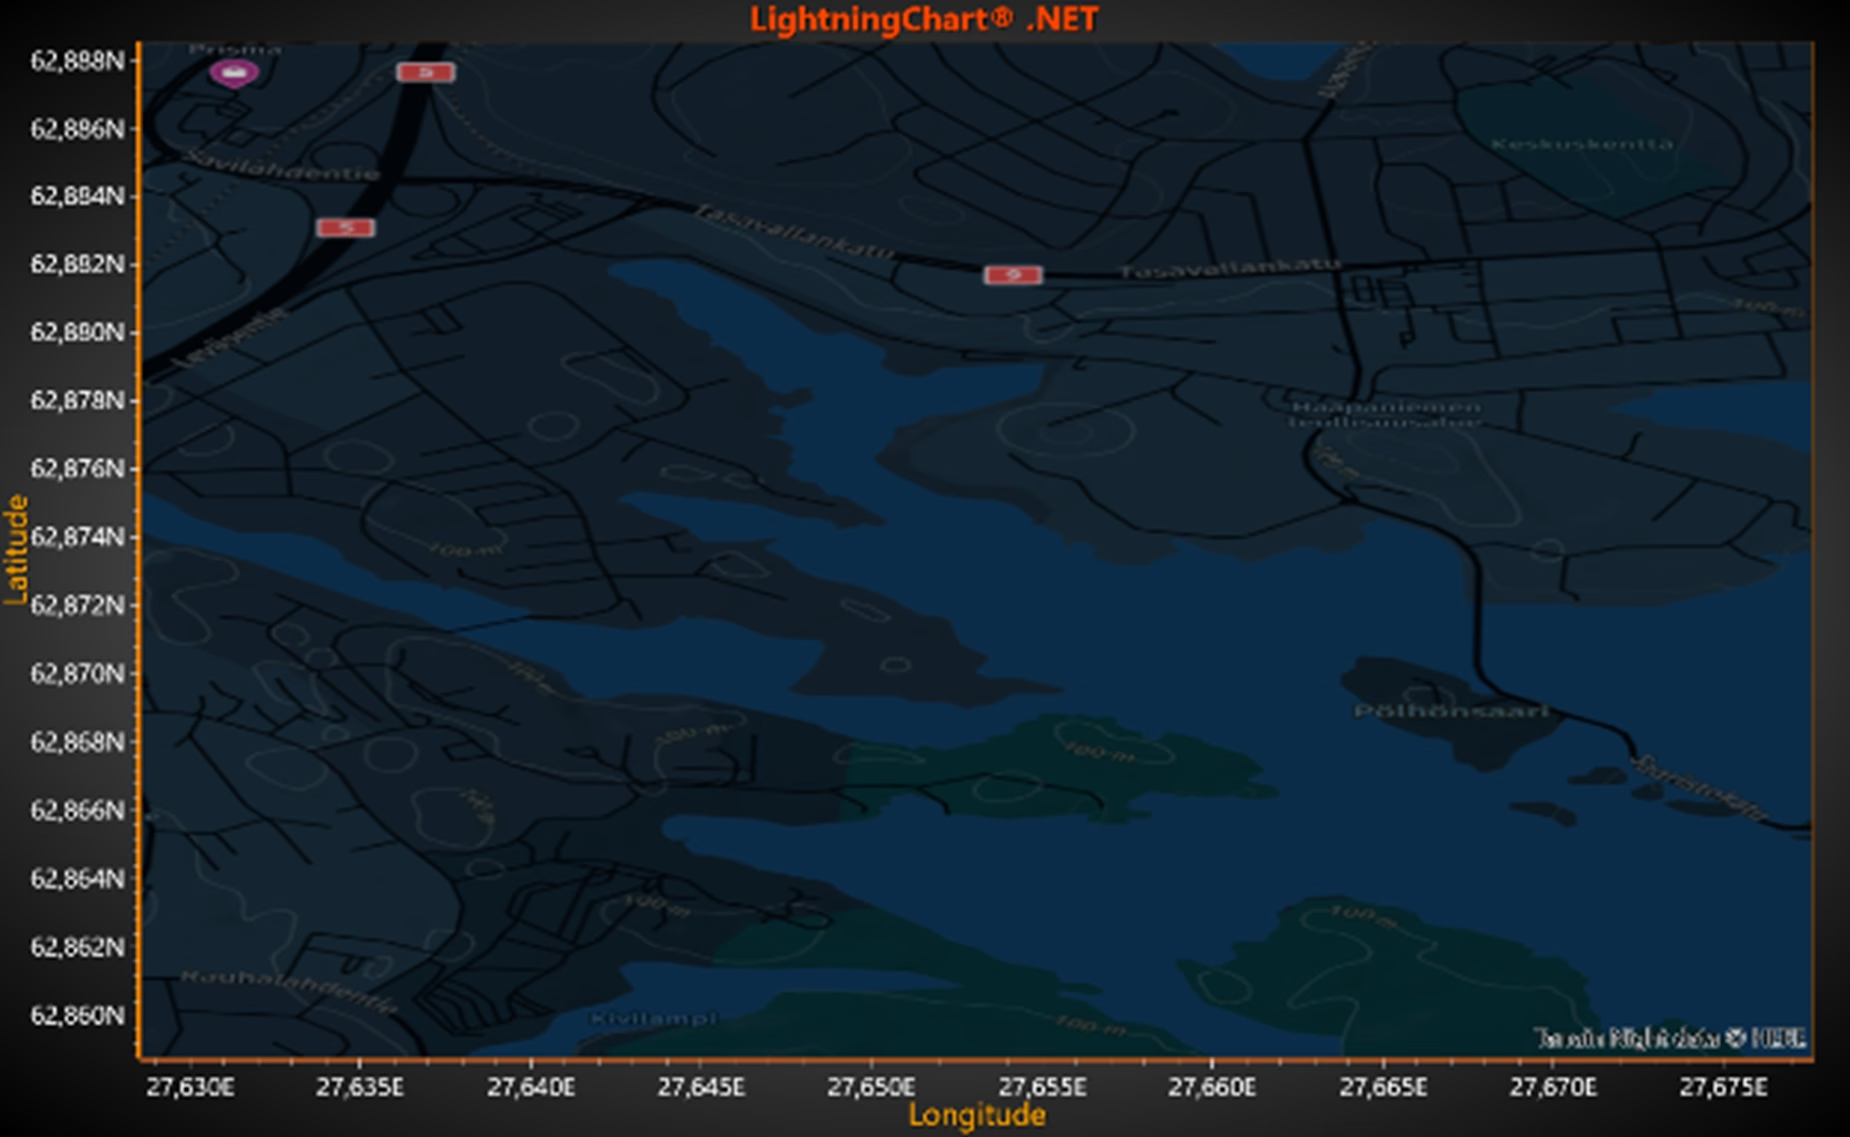
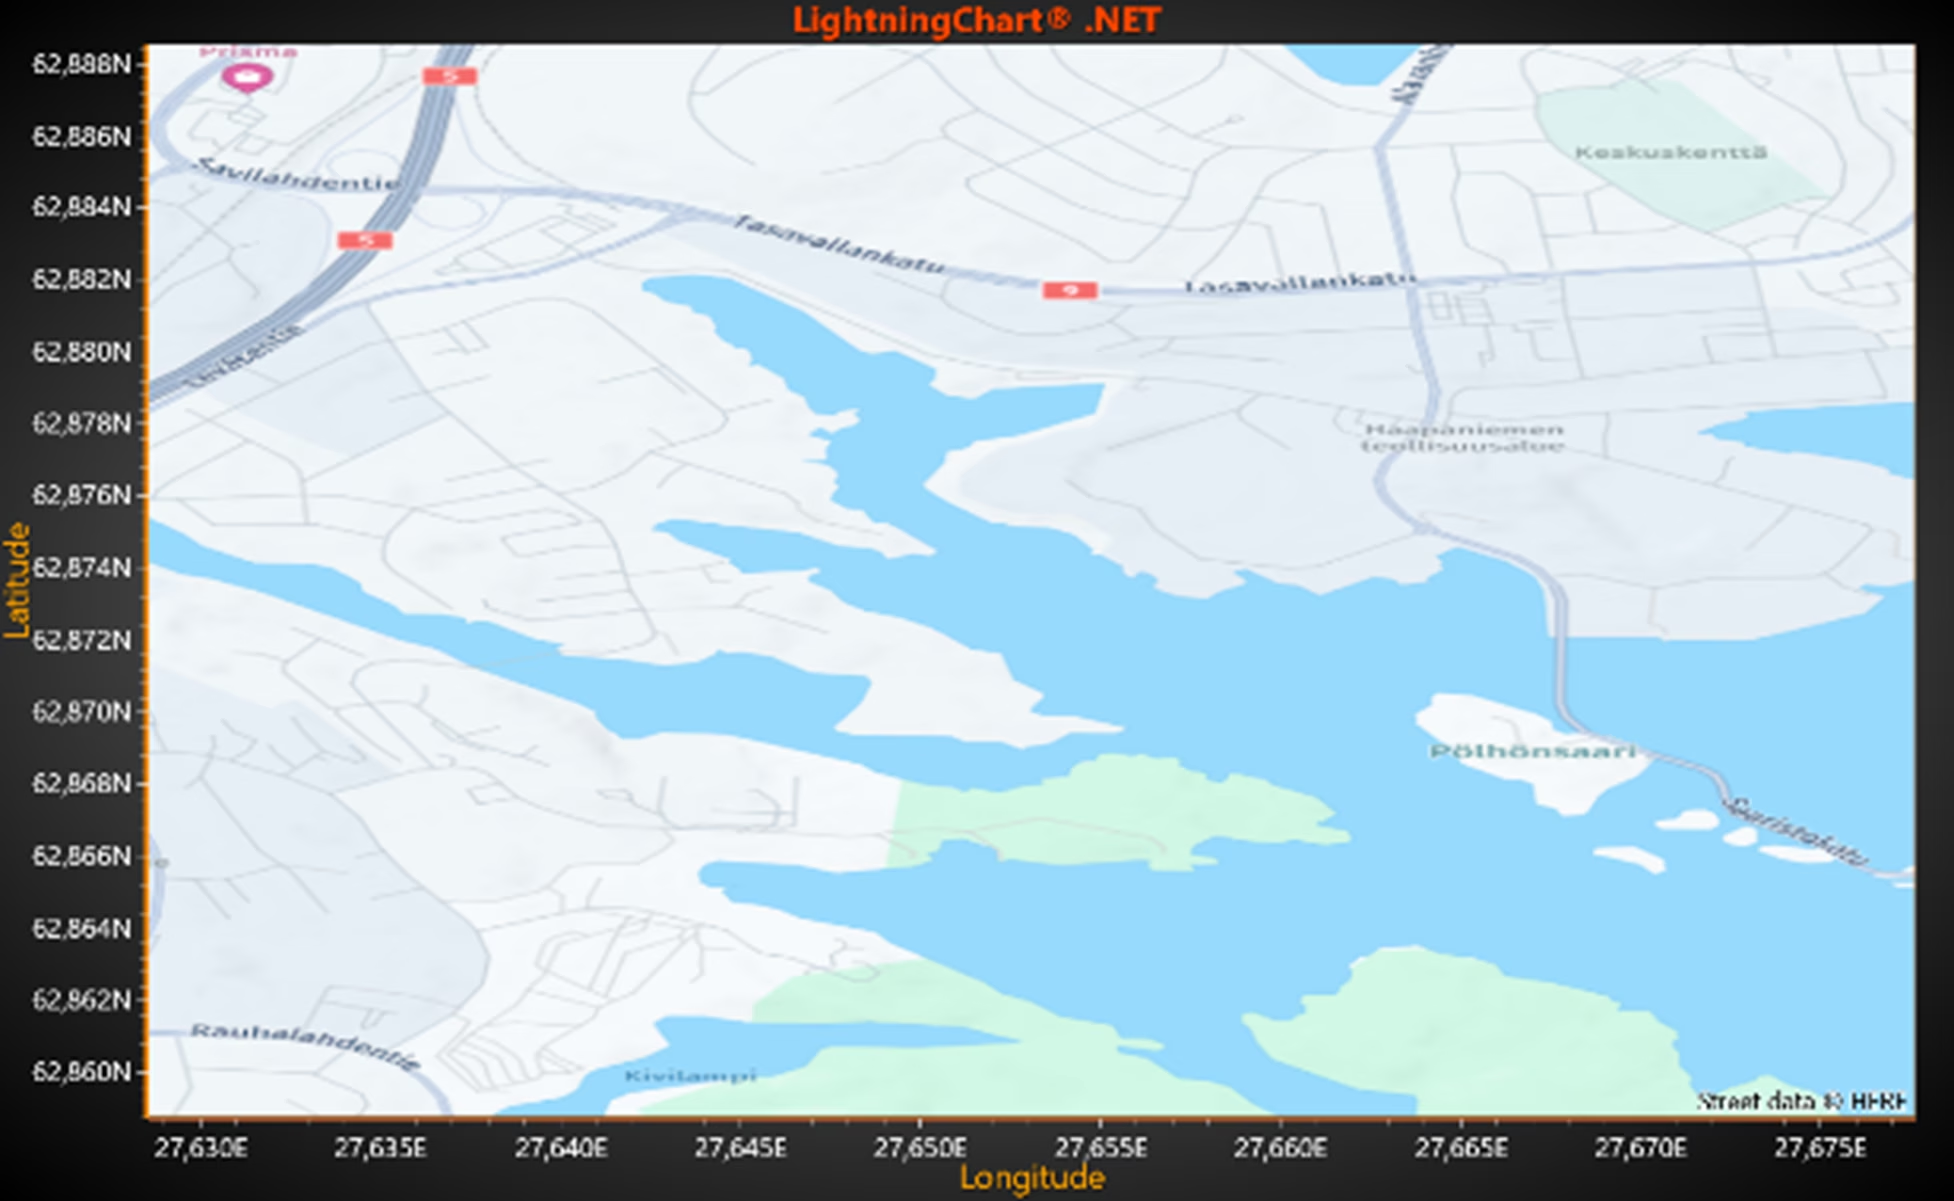
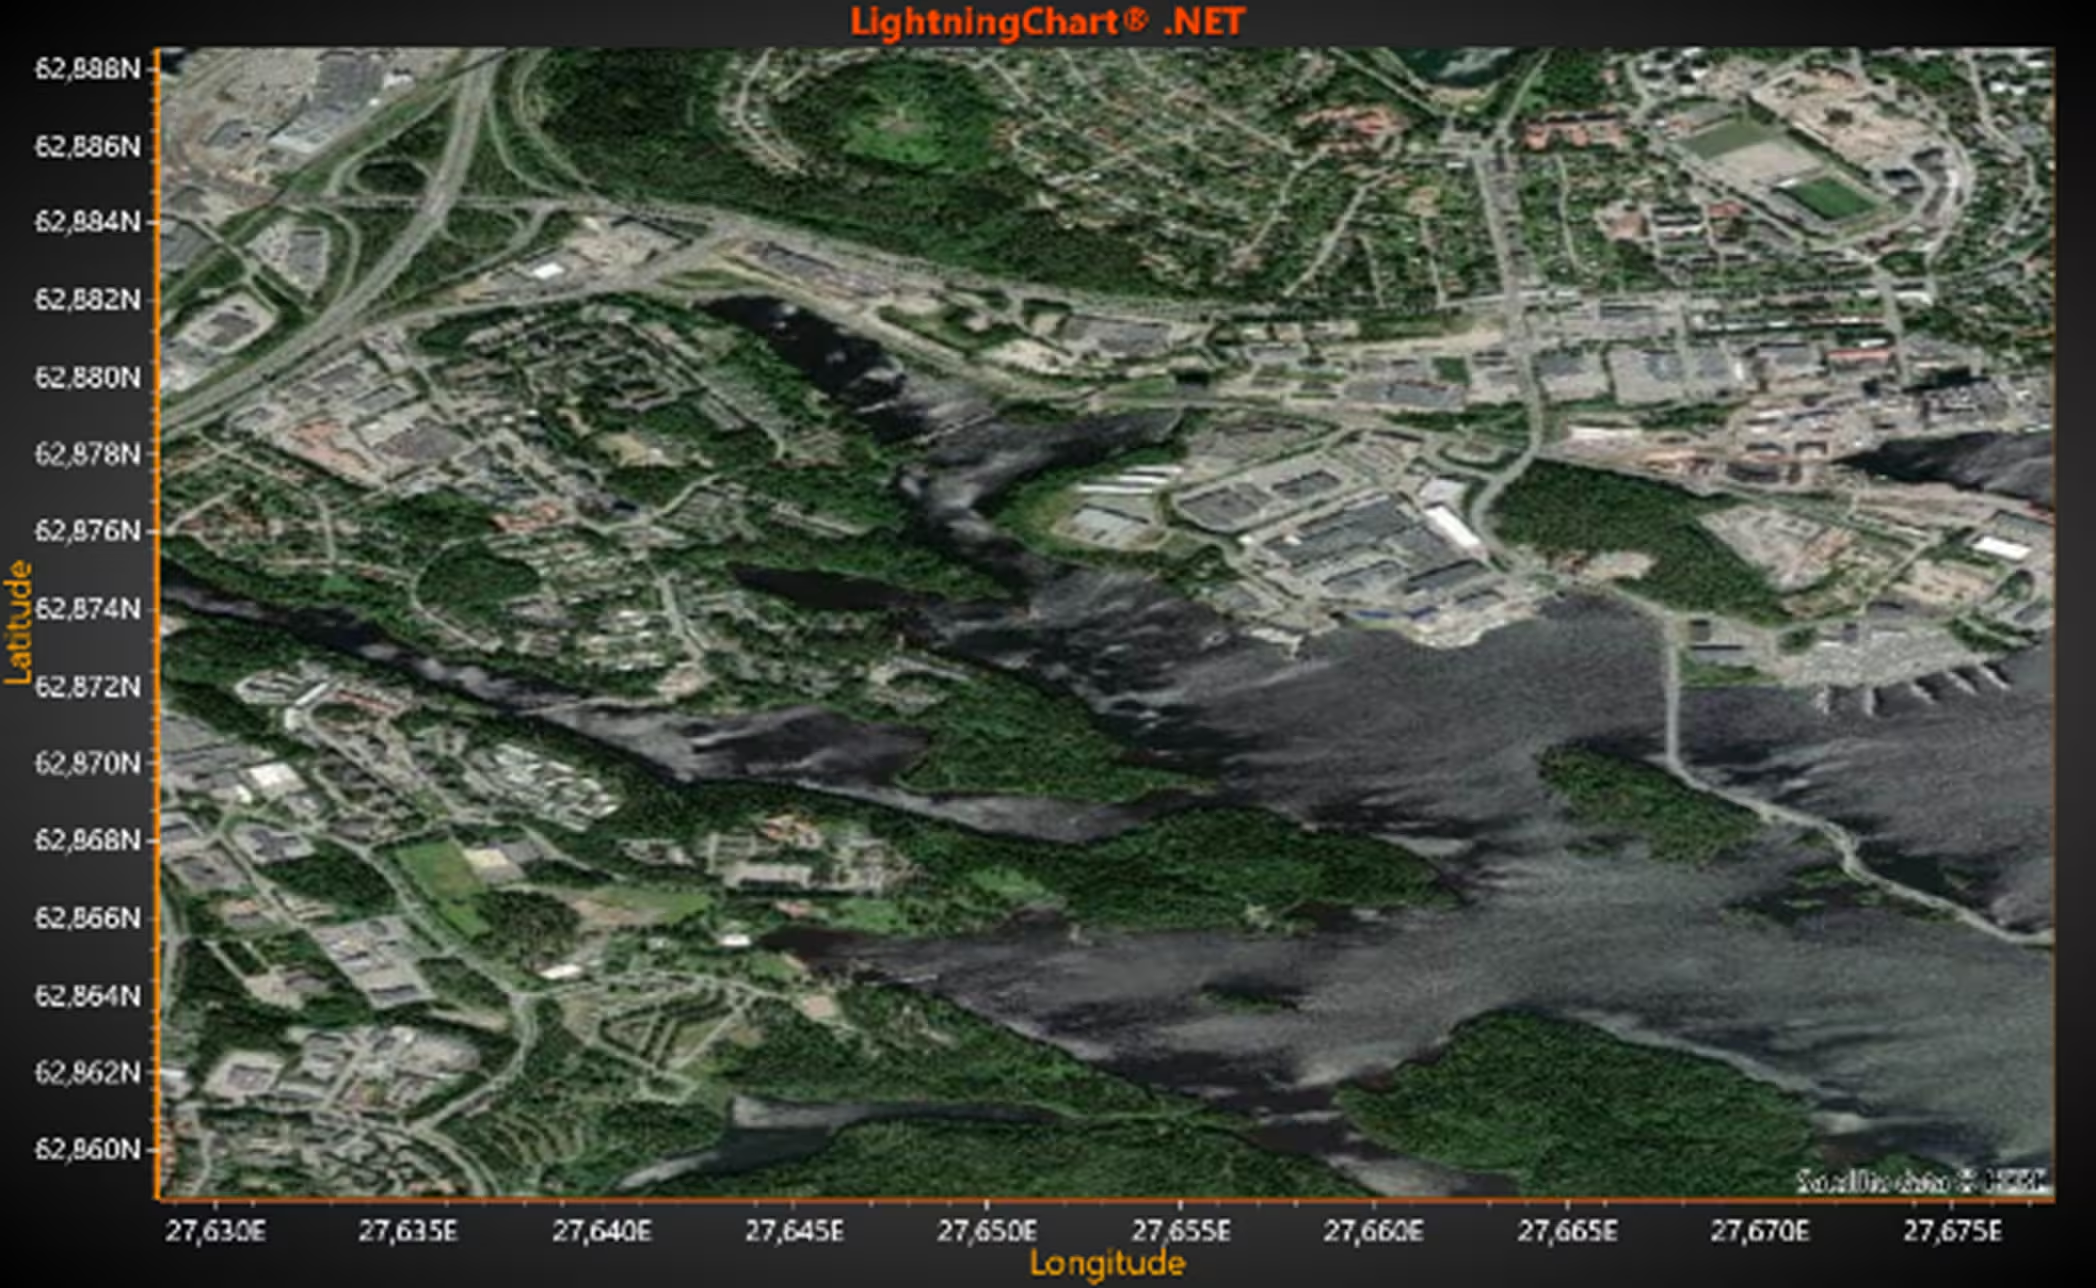
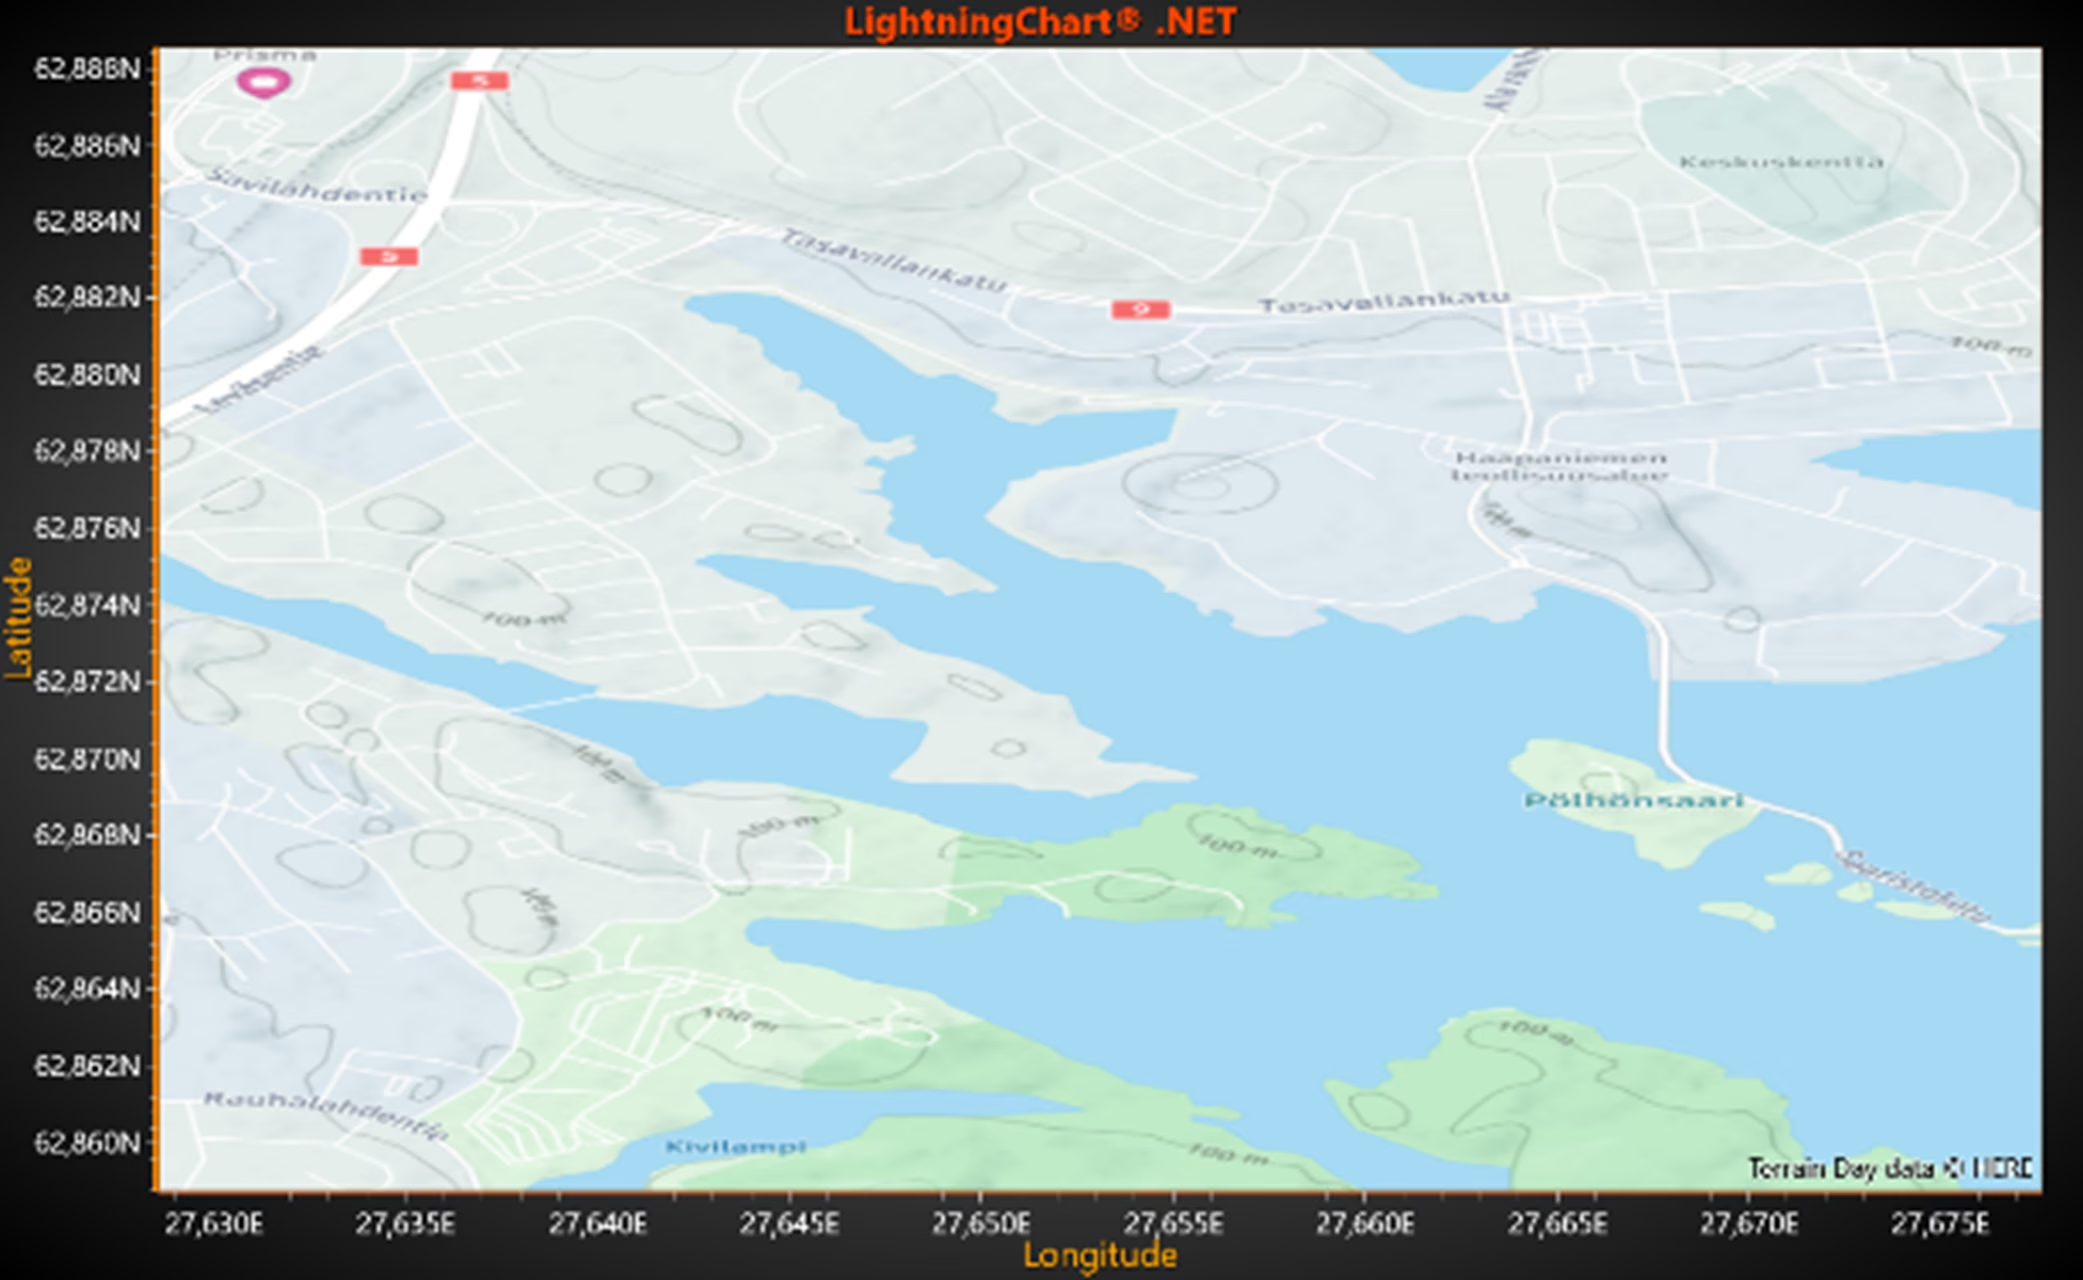
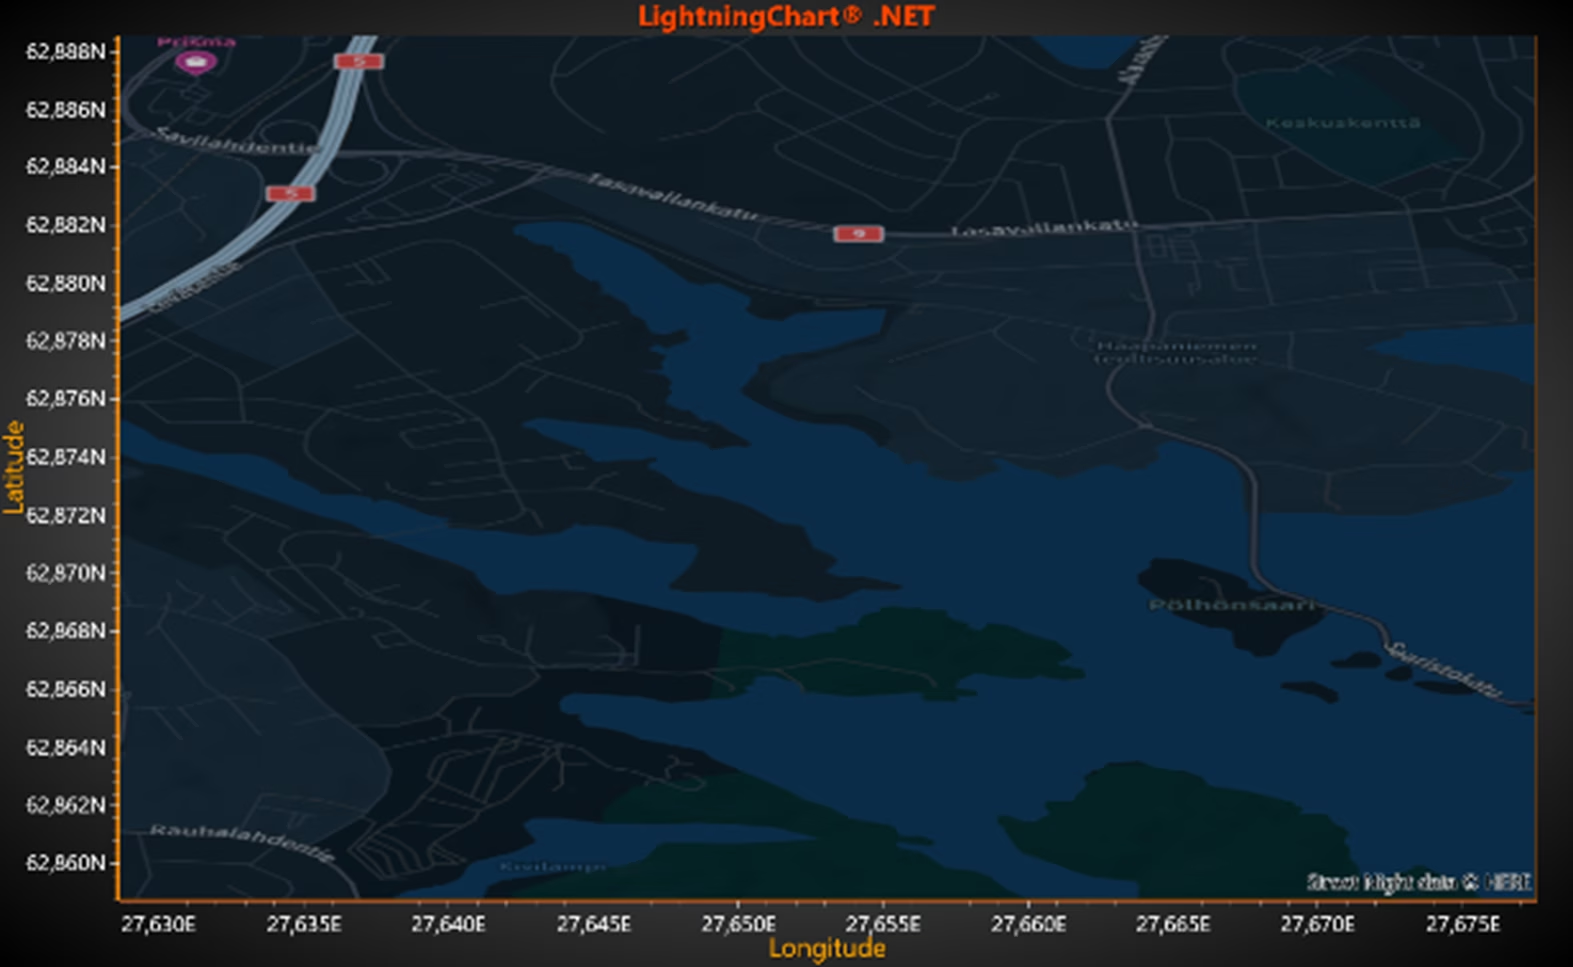
The HERE map rendering services have been updated to utilize HERE Raster Tile API v3. This update introduces additional LayerType options for Street and Satellite, specifically StreetNight, TerrainDay, and TerrainNight. Read more in the documentation.
.NET Interactive Examples App
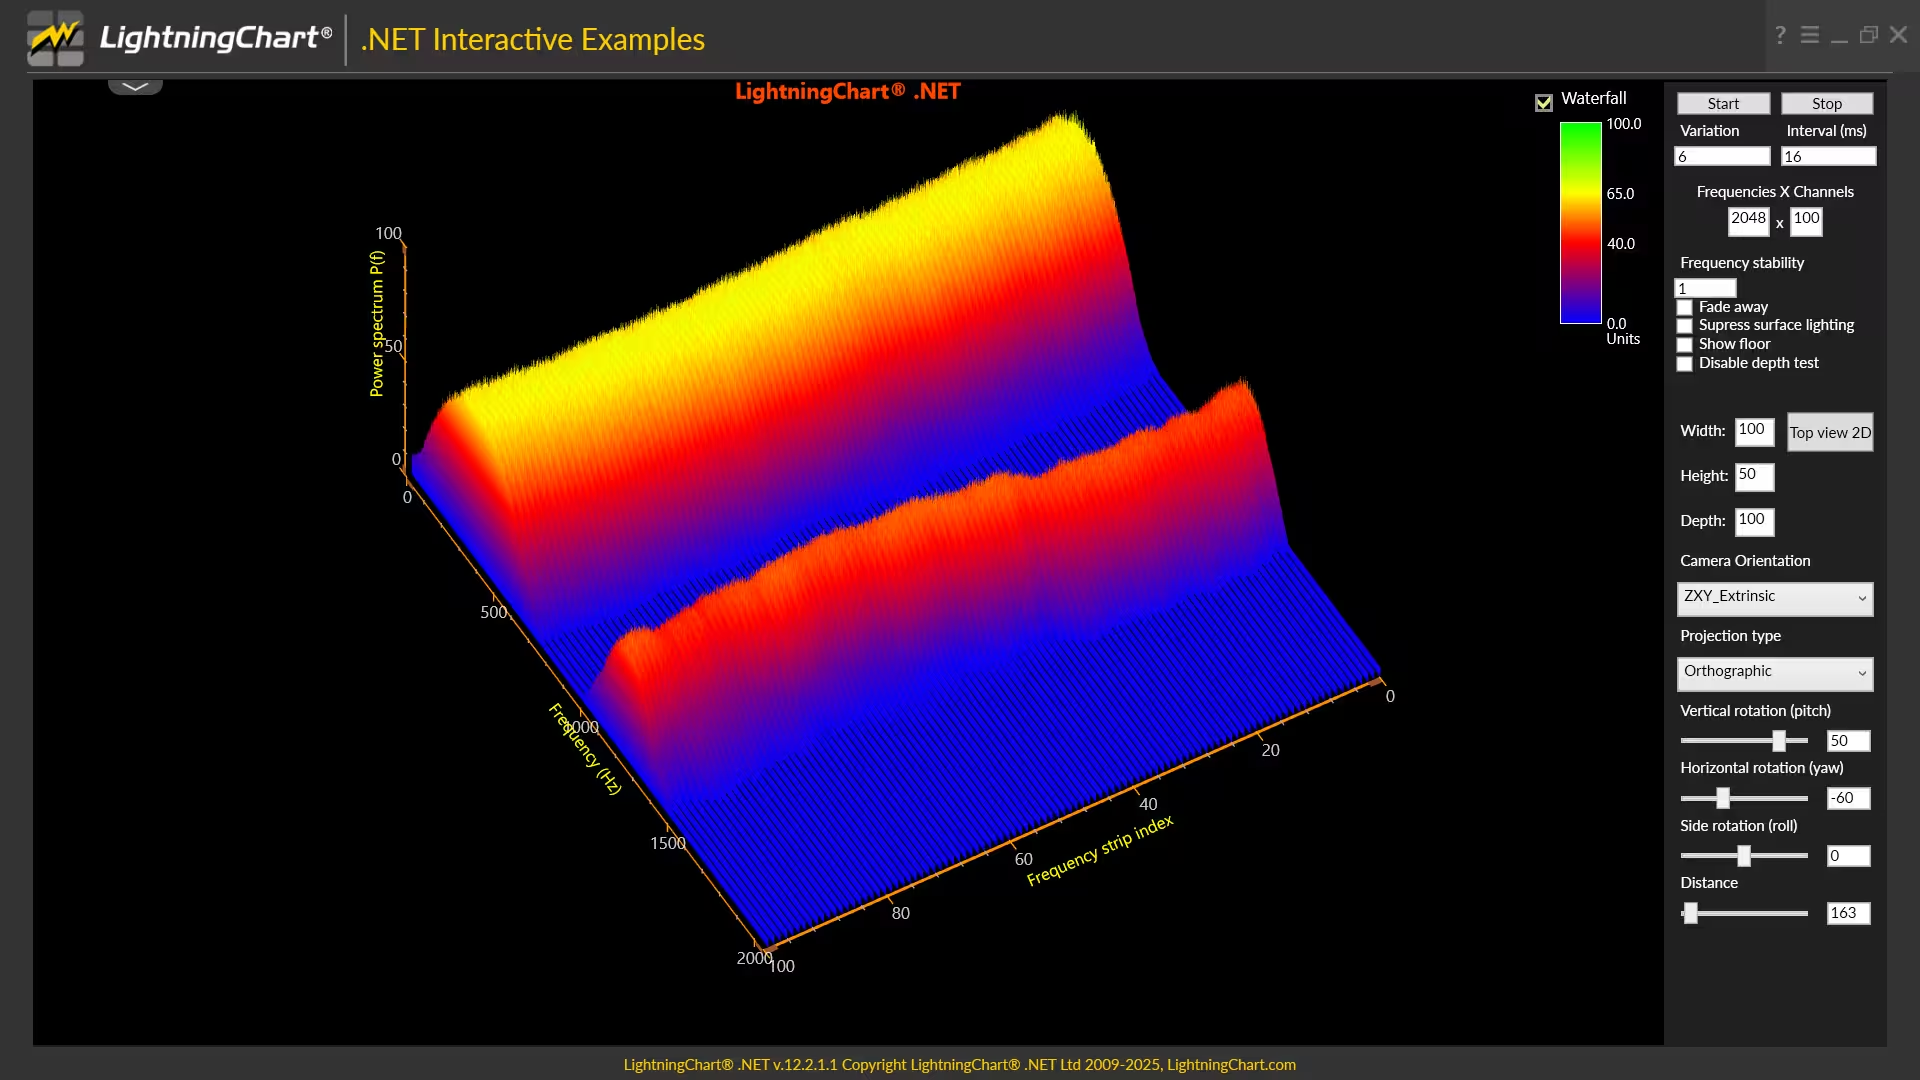
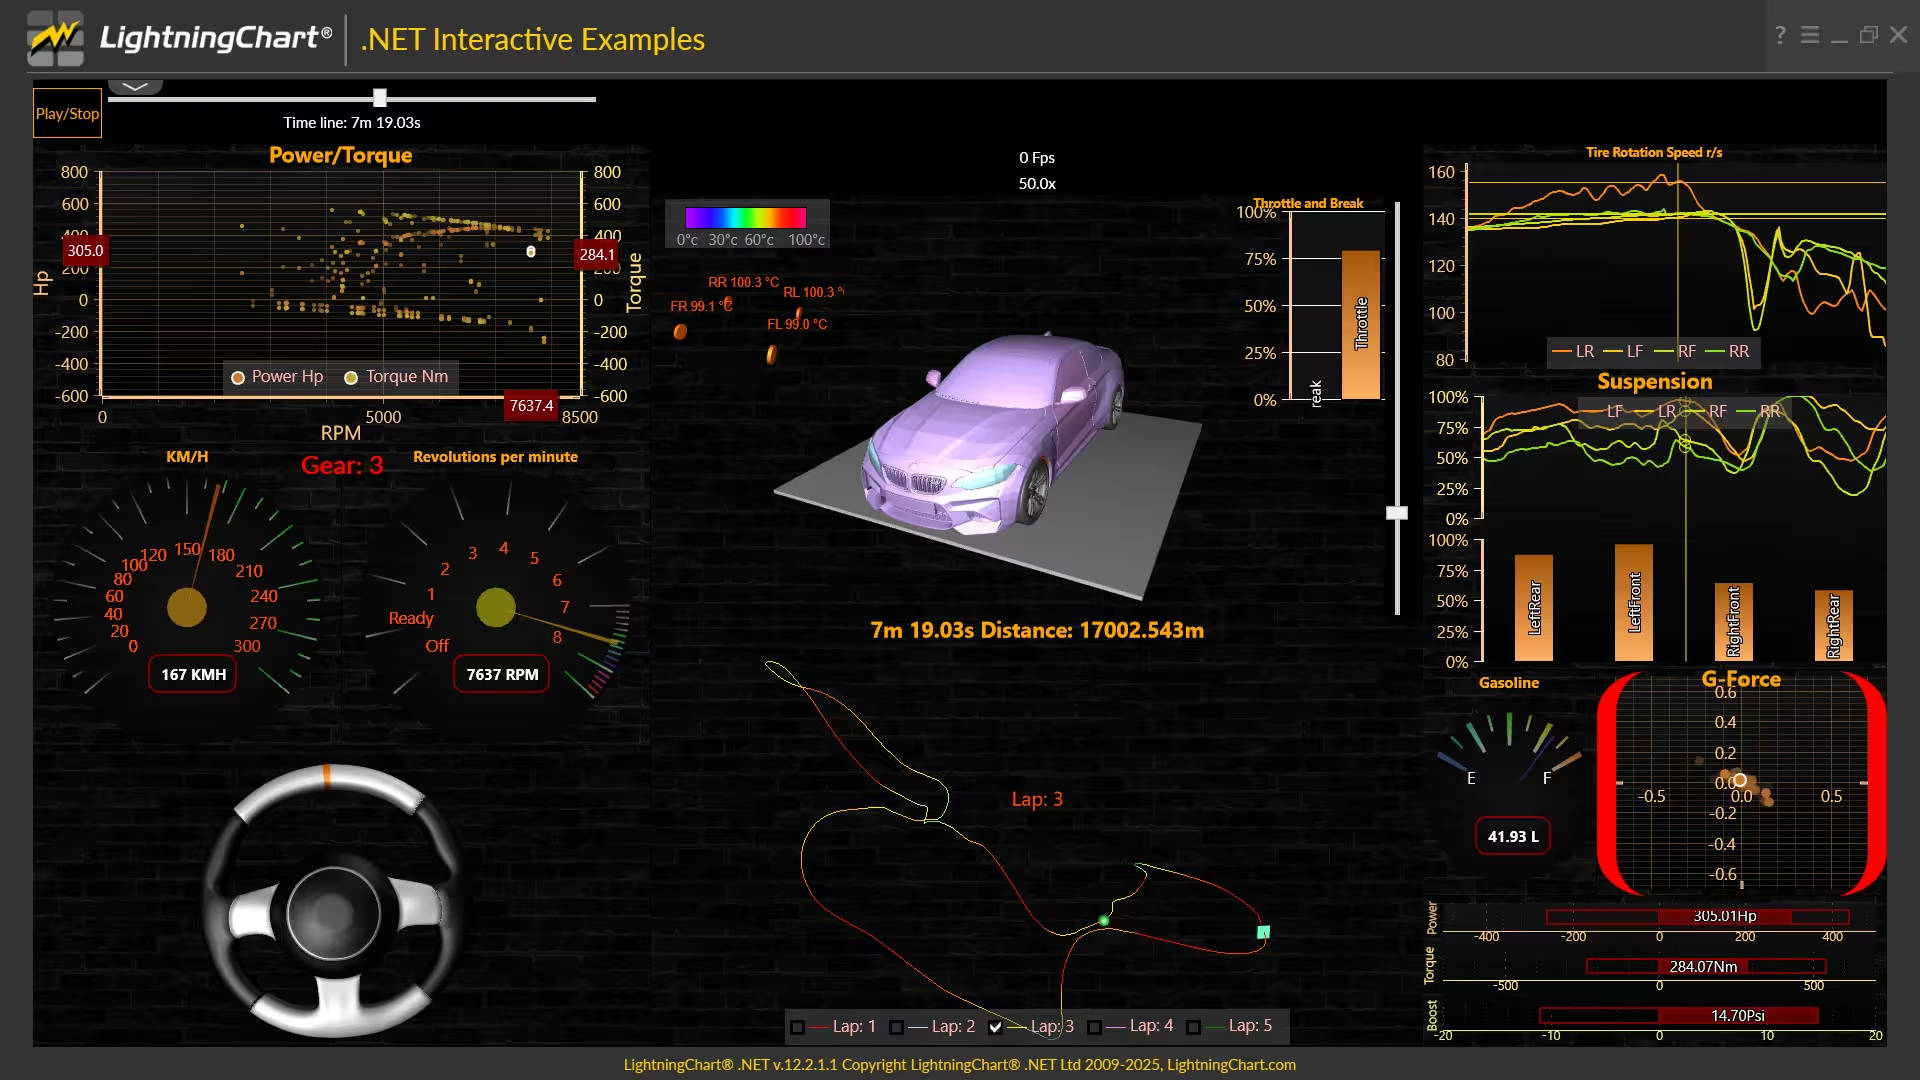
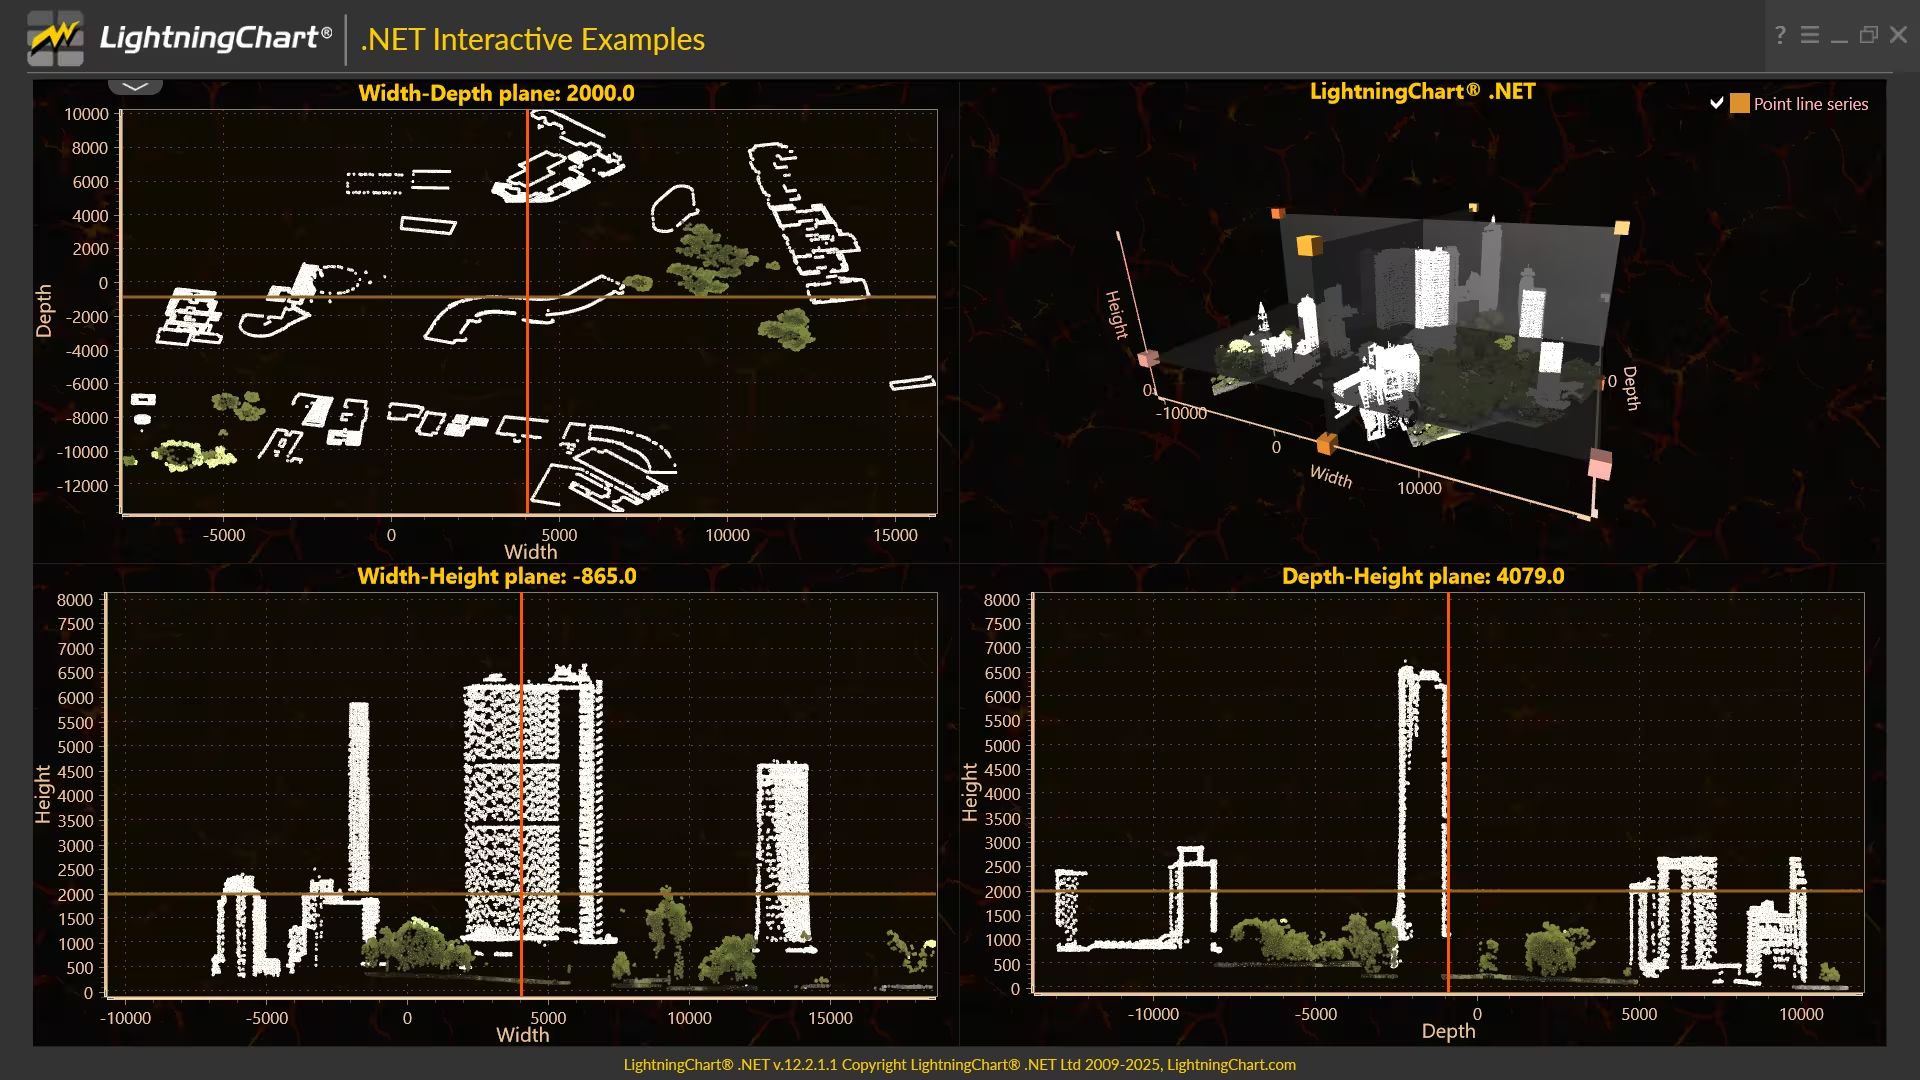
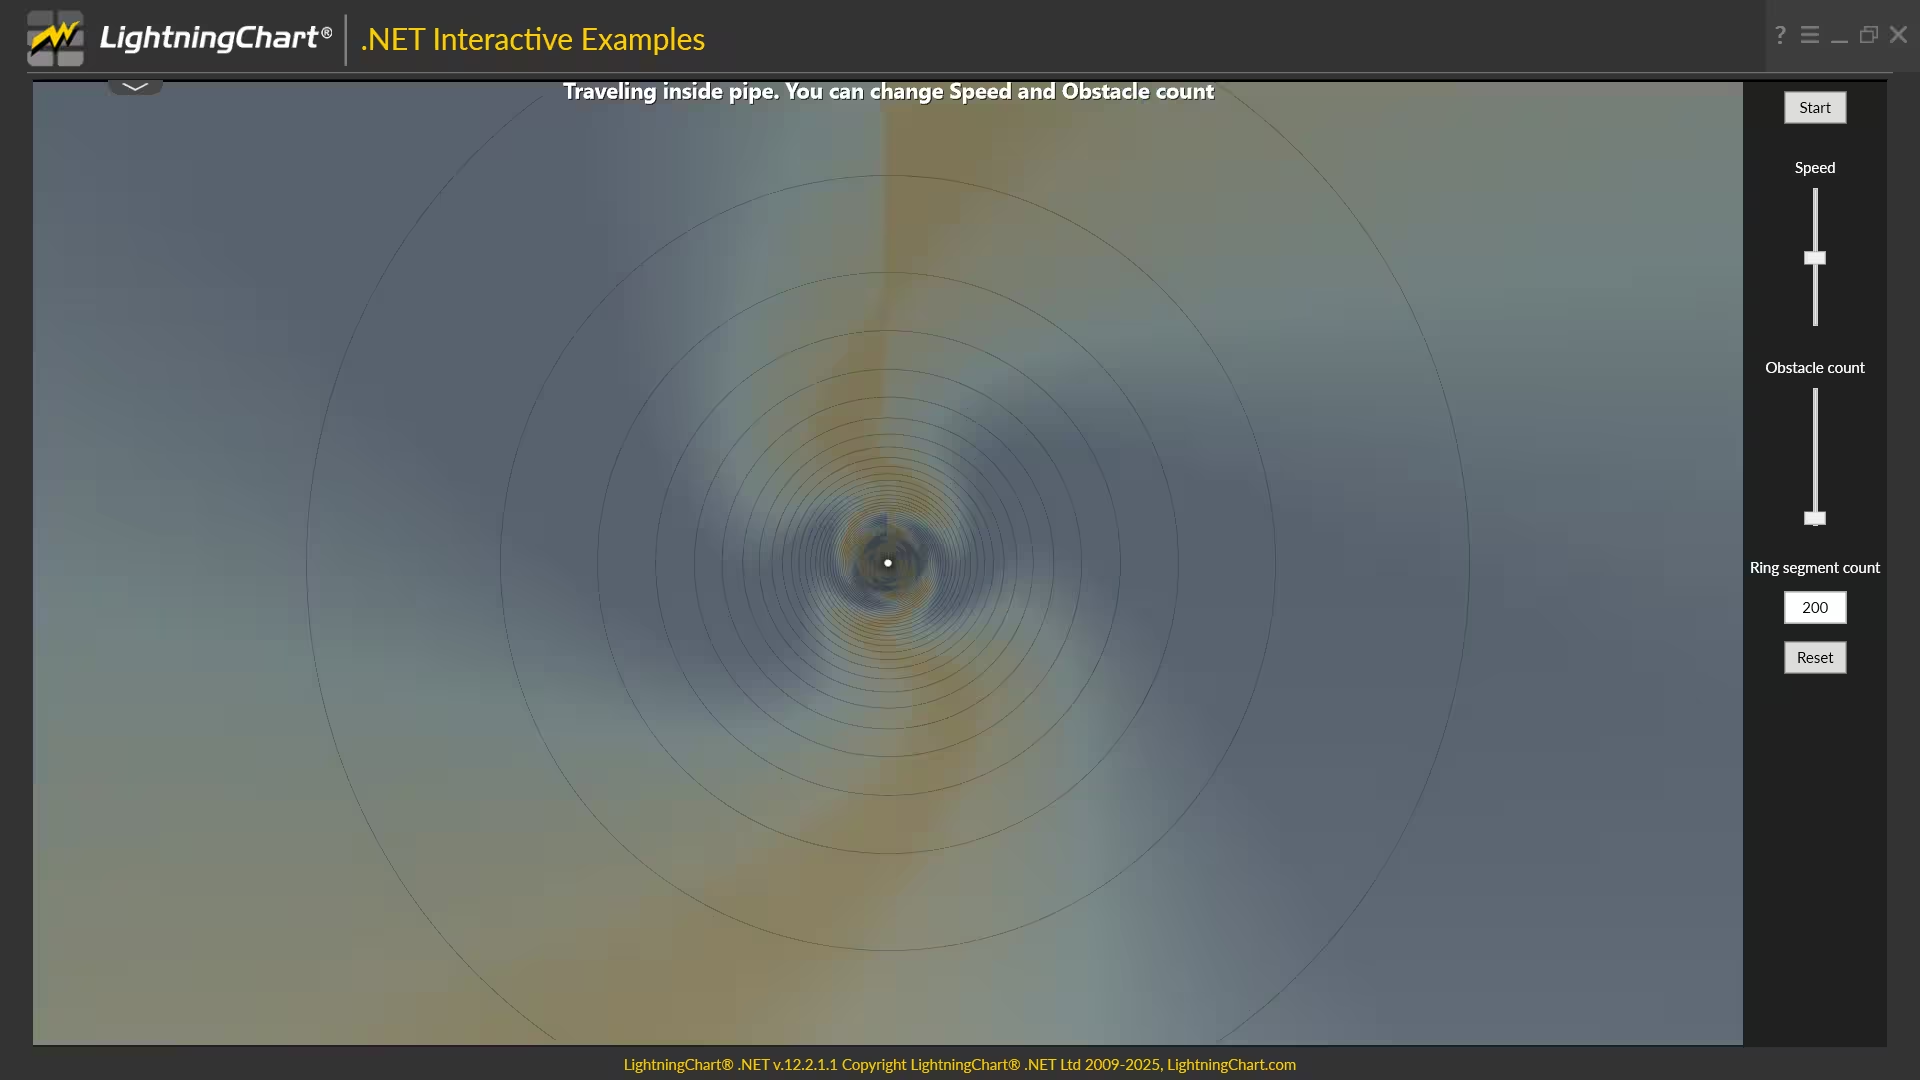
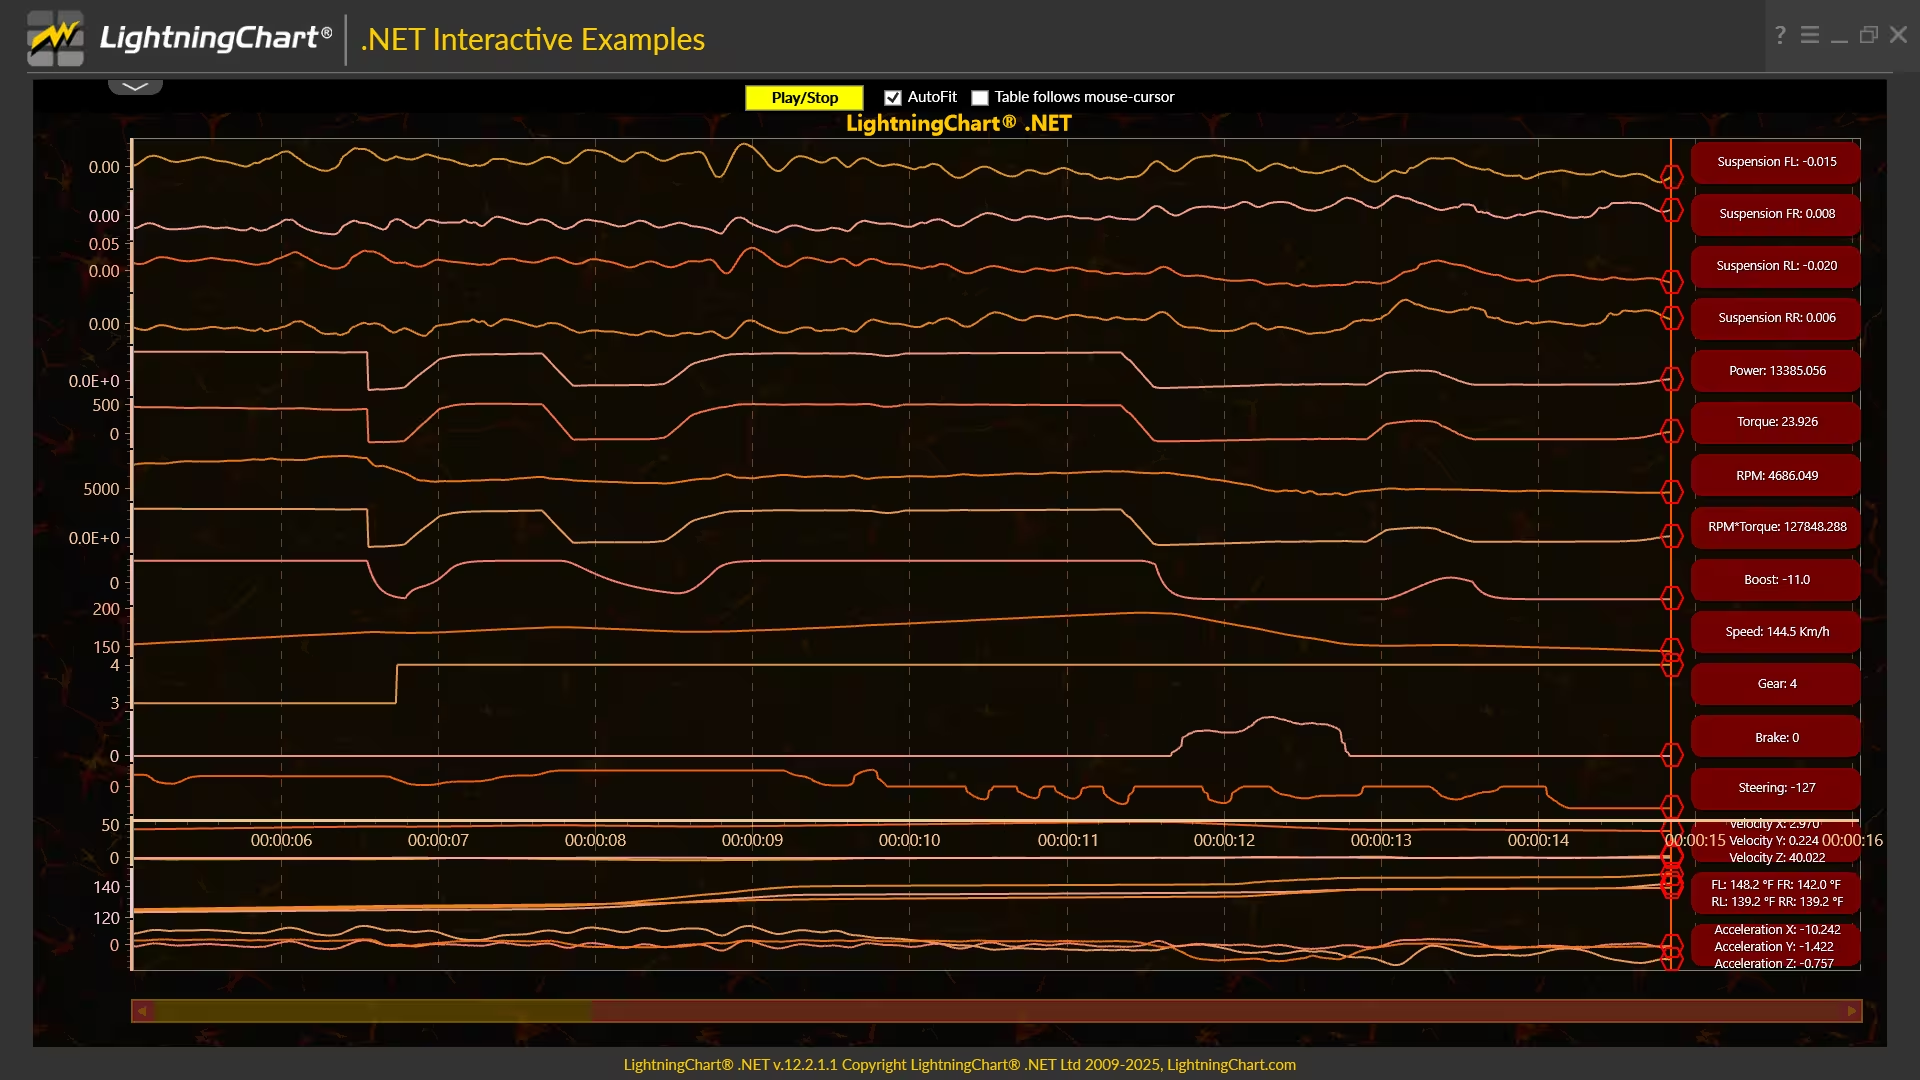
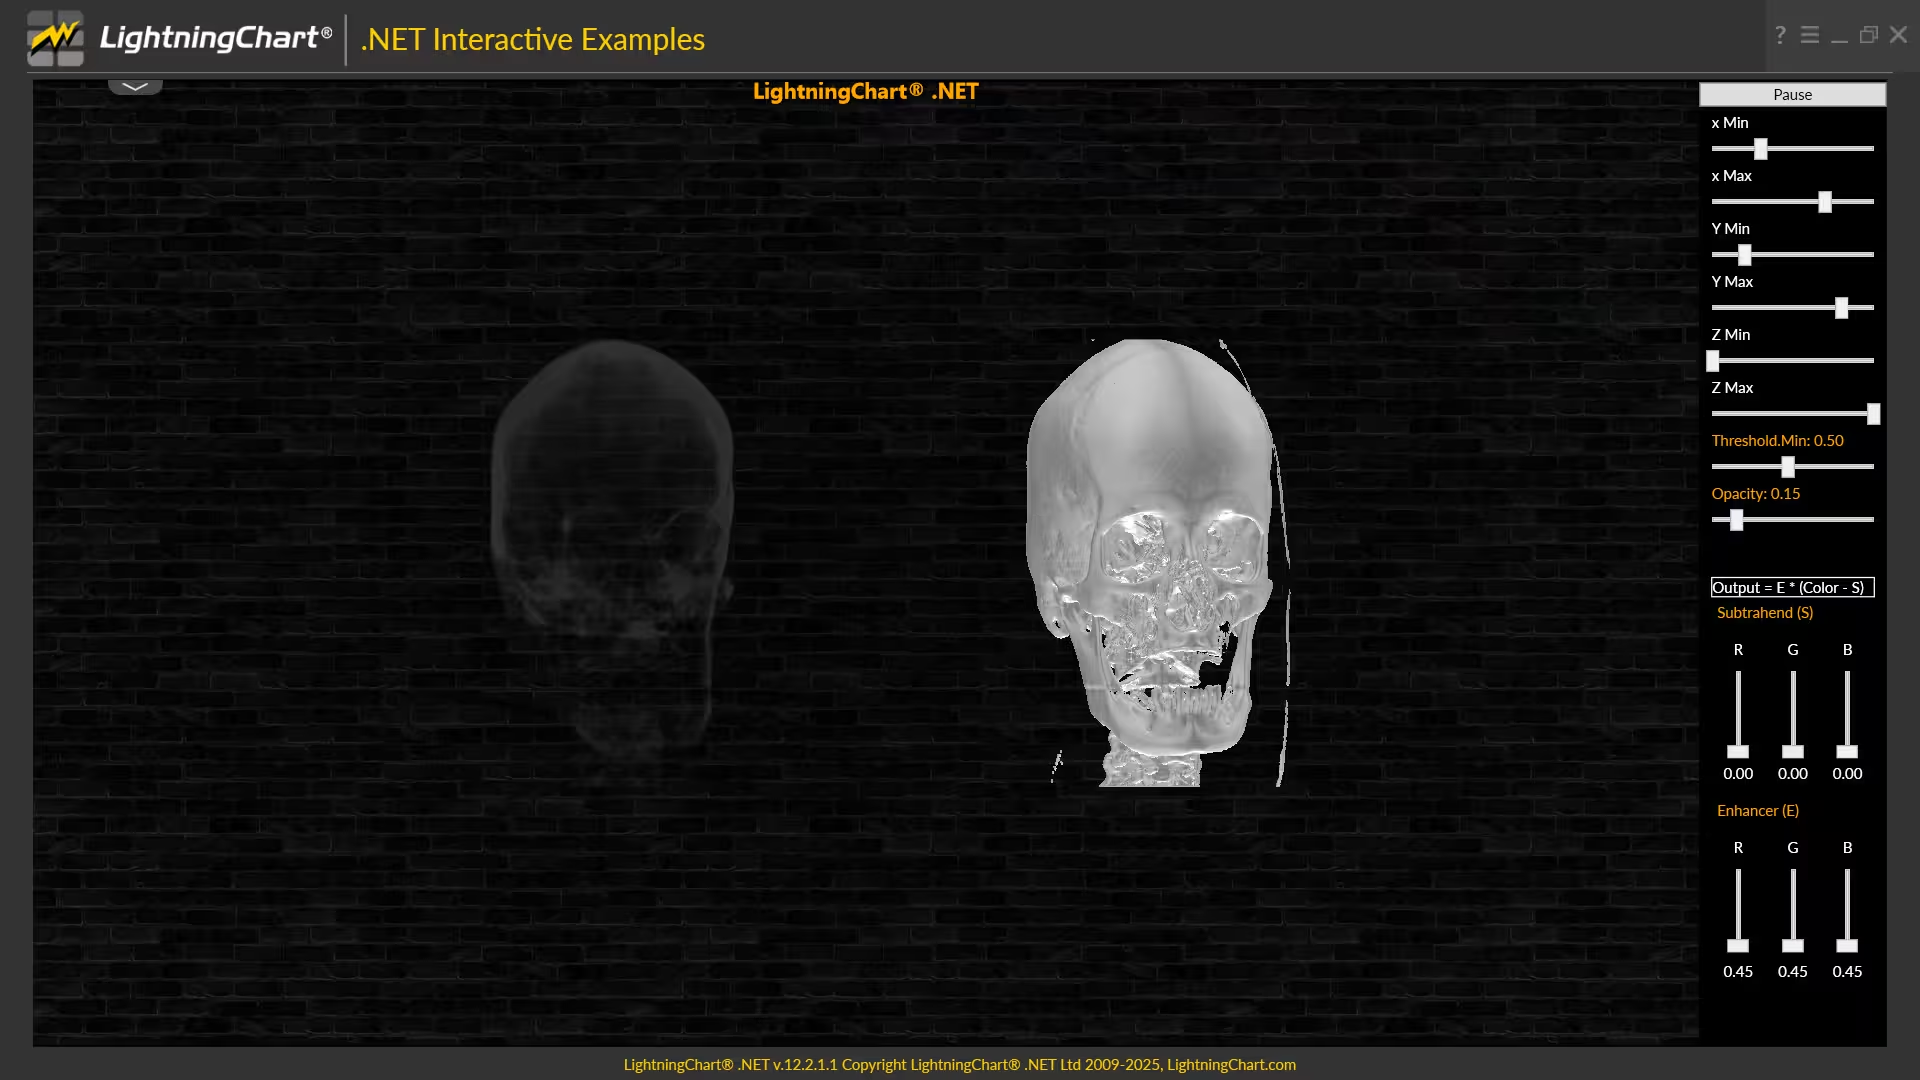
The Interactive Examples App has been updated with several enhancements to improve usability. These include a redesigned user interface for increased intuitiveness, improved tagging, and enhanced filtering capabilities for examples, you can further read about it in the documentation. Some of the changes include:
New & Improved Examples
Additionally, seven examples have been newly added or significantly revised. Users can now also export example code as .NET 8.0 projects.
.NET Trader improvements
The LightningChart library provides Trader libraries that offer controls, tools, and methods designed to simplify the development of trading and finance applications.
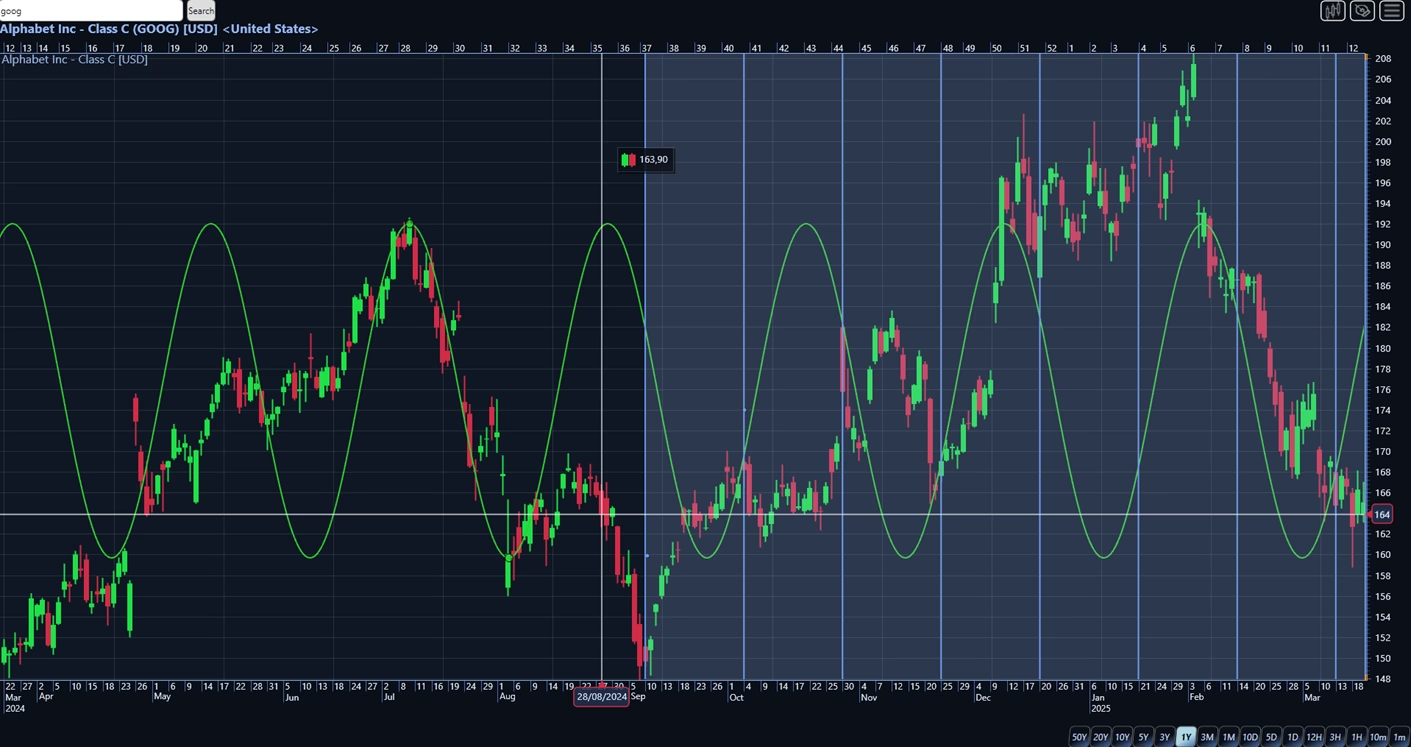
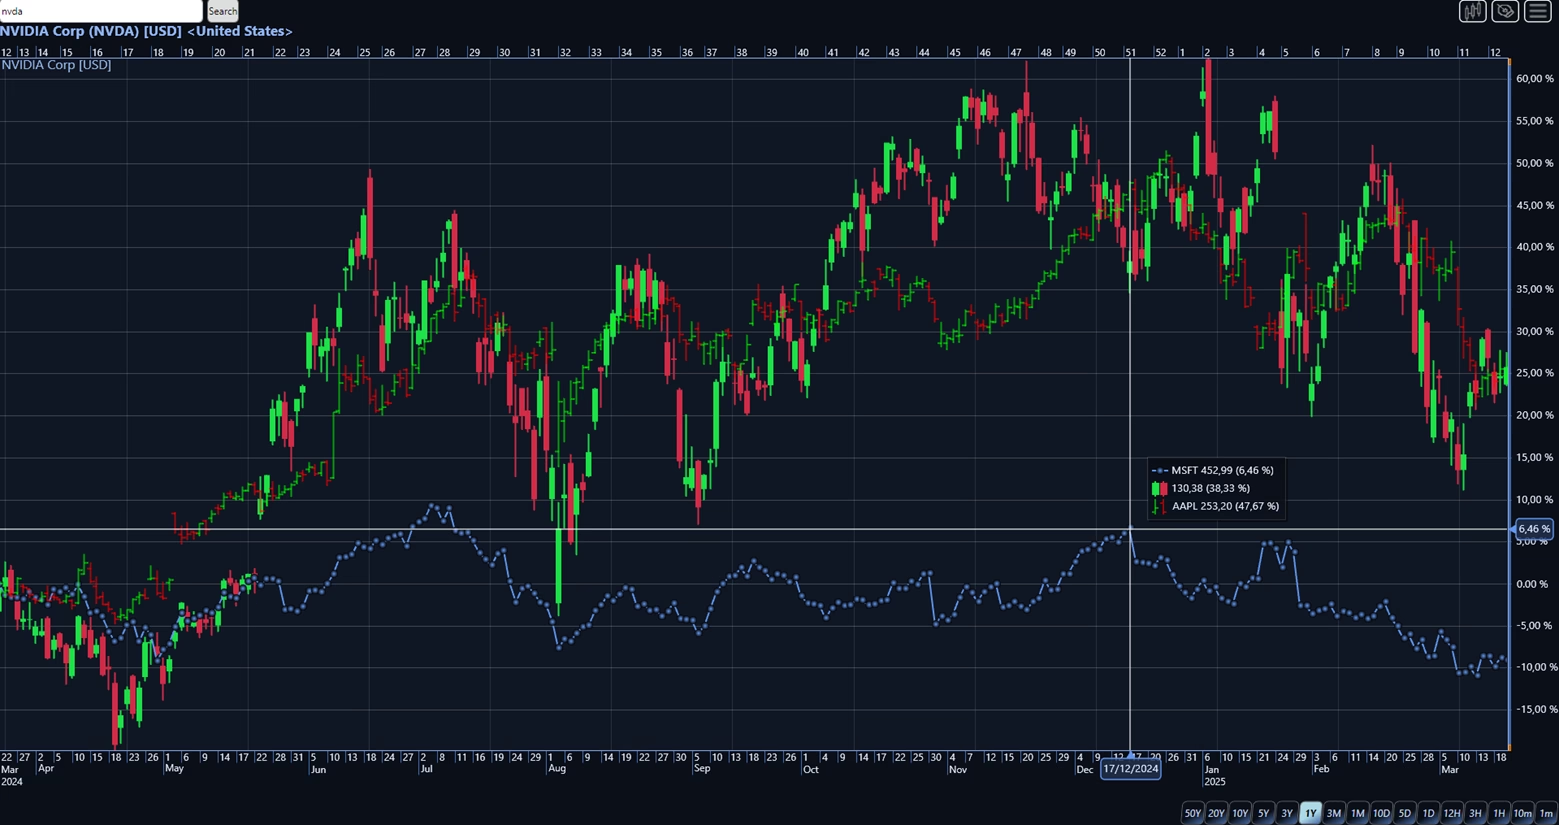
This release includes several enhancements to the Trader libraries, focusing on improved user interface elements, the addition of percentage and logarithmic axes, support for multiple ticker symbols, and the introduction or refinement of drawing tools.
The images below illustrate the Secondary Symbols feature, showcasing three datasets within a single chart, and the new drawing tools, specifically Sine Wave and Cycle Lines.
There are many other improvements and errors fixed, including improving the MeshModel performance, enhancing X-axis tick interval calculations, and the VolumeModel XAML serialization support.
Get started with LightningChart .NET v.12.2.1
See more news
LightningChart .NET v.12.6.1
LightningChart .NET v.12.6.1 is out now!Features of LightningChart® .NET version 12.6.1In this release we added new features, made several improvements and fixed dozens of errors. We upgraded target framework (from .NET 8.0 to 10.0), added Universal-Data-Parser...
Trend Lines in Trading
Trend lines are among the simplest yet most powerful tools in technical analysis. They help traders visualize market direction, identify potential support and resistance levels, and make more informed trading decisions. Despite their simplicity, trend lines remain a...
Announcement: Baumer as LightningChart customer
Enabling High-Performance Visualization of Industrial Sensor Data with LightningChartDiscover how Baumer uses LightningChart to configure and visualize data from a wide variety of industrial sensors and create responsive, data-rich visualization...
Best Python Charting Library in 2026
Python's charting ecosystem is large, overlapping, and regularly misunderstood. Most comparison guides stop at Matplotlib, Plotly, and Seaborn. This one goes further: it covers what happens when your datasets grow large, your update rates increase, or your chart types...



If you have any questions, feel free to contact us!



©LightningChart Ltd 2026. All rights reserved.





