Geographic maps (in ViewXY)
Use Maps property and its sub-properties to show geographic maps. LightningChart maps come in two different categories: vector maps and tile maps. The maps are shown in so called equirectangular projection.
This projection allows using LightningChart’s ViewXY series types and other objects that are practically all bound to X and Y axes, same time as the maps.

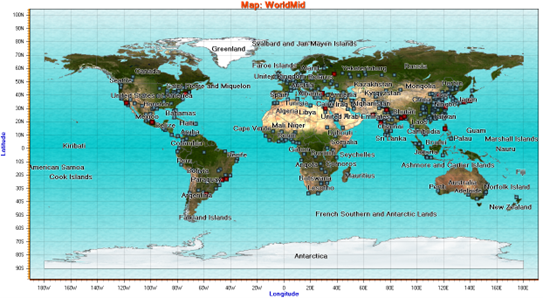
Equirectangular projection of the world. X range is from -180 to 180 degrees (180W to 180E), Y range from -90 to 90 degrees (90S to 90N). Polar areas get greatly stretched in this projection.
Vector maps
The geographic vector data is stored in LightningChart map files, with .md extension. LightningChart is delivered with set of map files.
The X-axis is used for Longitude, and the Y-axis for latitude. See subchapter Value type for showing map coordinate axes. The map coordinates are decimal degrees, with latitude origin at equator and longitude origin at Greenwich, U.K.

Maps’ properties and sub-properties. The whole tree is for vector maps, except TileLayers collection and TileCacheFolder, which is for tile maps.
Selecting active map
Set the directory name to the Path property, where the map files exist (if not set, LightningChart will be looking for default folder C:\ProgramData\LightningChart\Maps). The active map can be selected with Type property, for maps delivered with LightningChart. To use an own map file, set the FileName property.
If no maps are wanted, set Type to Off.

Map Type options. The maps delivered with LightningChart are shown. The type name postfix tells a rough detail level of the map.
In general, the maps of LightningChart are made in very high detail level. For real-time monitoring solutions it is important to select a map giving proper detail and performance level.
Aspect ratio
ViewXY.ZoomPanOptions.AspectRatioOptions.AspectRatio controls the X/Y (or longitude / latitude) ratio.
Set it to Off to enable X and Y axis range setting individually allowing stretching the map. AutoLatitude changes the aspect ratio dynamically when viewing the map in different locations. The aspect ratio is determined by the center point of the view. By setting the aspect ratio to Manual, use the ManualAspectRatioWH property to set the preferred ratio. See subchapter Aspect ratio for detailed explanation of how aspect ratio is calculated.
Layers and their appearance settings
Each map file can contain several layers. For example, layers for land regions, lakes, rivers, roads and cities. The layers and their data are accessible from Layers array property.

Map layer details opened in Properties editor
Each layer has a specific type. The layer appearance options can be changed with corresponding 'options' property. Use (ViewXY. Maps.) LandOptions for modifying the appearance of land regions, LakeOptions for lakes, RiverOptions for rivers, RoadOptions for roads, CityOptions for cities, and OtherOptions for unspecified layer types.
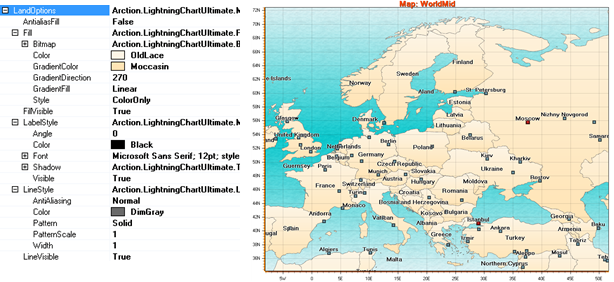
Default LandOptions, and corresponding view from Europe
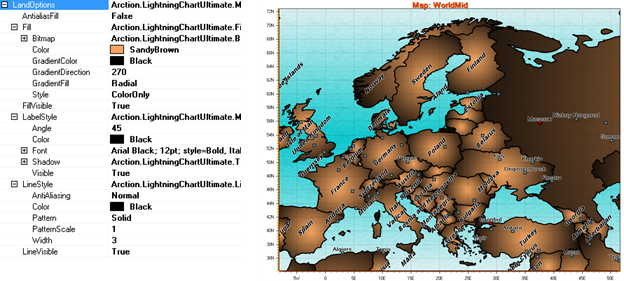
Modified LandOptions
Setting individual fill and border style for each layer item
Each map element fill or border appearance can be set individually. [for example, for Maps.Layers[i].Type == 'Land', but not type 'City']. For that, change Maps.Layers[i] properties BorderDrawStyle and RegionDrawStyle to Individual (instead of Options). Then, access the Items collection, and navigate to preferred item and edit the BorderLineStyle and Fill properties. The Items collection can be navigated programmatically by Name property (in below image it is “Germany”).
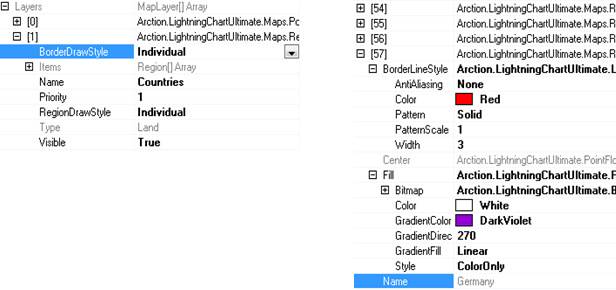
Setting layer border line and region fill styles to Individual and editing region in Items collection.
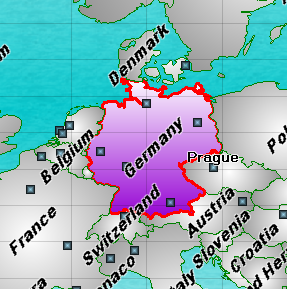
Germany region drawn with individual fill and border
Mouse interactivity
Enable Maps. AllowUserInteraction for all kinds of interoperation with map regions and objects. Regions (land, lakes) and vector layers (rivers, roads) can be pointed with mouse cursor. Once the mouse is over an object, it gets highlighted with SimpleHighlightColor, if Highlight is set to Simple. When Highlight is set to Blink, the object will blink in light and dark colors. By setting Highlight to None, the object is not highlighted, but it still can be clicked and for example used to invoke Maps. ButtonDownOnMapItem event.
Map objects may have associated data included, like population or other statistical data. Use OverOnMapItem/ OverOffMapItem /ButtonDownOnMapItem event handler to access the data. The data for a map item can be retrieved with GetInfo method, giving a dictionary of keys and values.
Here’s an example of how to show all data in a list box. The item name is displayed in a different text box.
private void ButtonDownOnMap(ButtonDownOnMapItemEventArgs args)
{
    MapItem mapItem = args.MapItem;

    textBoxCountryName.Text = m_chart.ViewXY.Maps.Layers[args.Layer].Name + ": " + mapItem.Name;
    listBoxItemValues.Items.Clear();
    if (mapItem.GetInfo() != null)
    {
        Dictionary<string, string> dict = mapItem.GetInfo();
        Dictionary<string, string>.KeyCollection keys = dict.Keys;
        foreach (String key in keys)
        {
            String strValue;
            if (dict.TryGetValue(key, out strValue))
            {
                listBoxItemValues.Items.Add(key + ": " + strValue);
            }
        }
    }
}
Background photos
Adding a MapBackground object in Maps. Backgrounds property allows displaying bitmap images as the backgrounds of the maps. Satellite images or other raster images are available from several GIS data providers. The image can be set to Image property, and its latitude and longitude range can be set with LatitudeMin, LatitudeMax, LongitudeMin and LongitudeMax properties. The image is not displayed outside the set ranges.
To show the background through the map layers, it may be necessary to adjust the fill settings for each layer. Use transparent colors or colors with low alpha level.
Map of the world. LandOptions.FillVisible is set to false, and one background image is set to latitude range of -90�…90 and longitude range of -180…180. The map region borders and cities are shown.
Combining other series with maps
Geographical maps can be combined with any ViewXY series type. The maps are drawn in the background and the series over them.
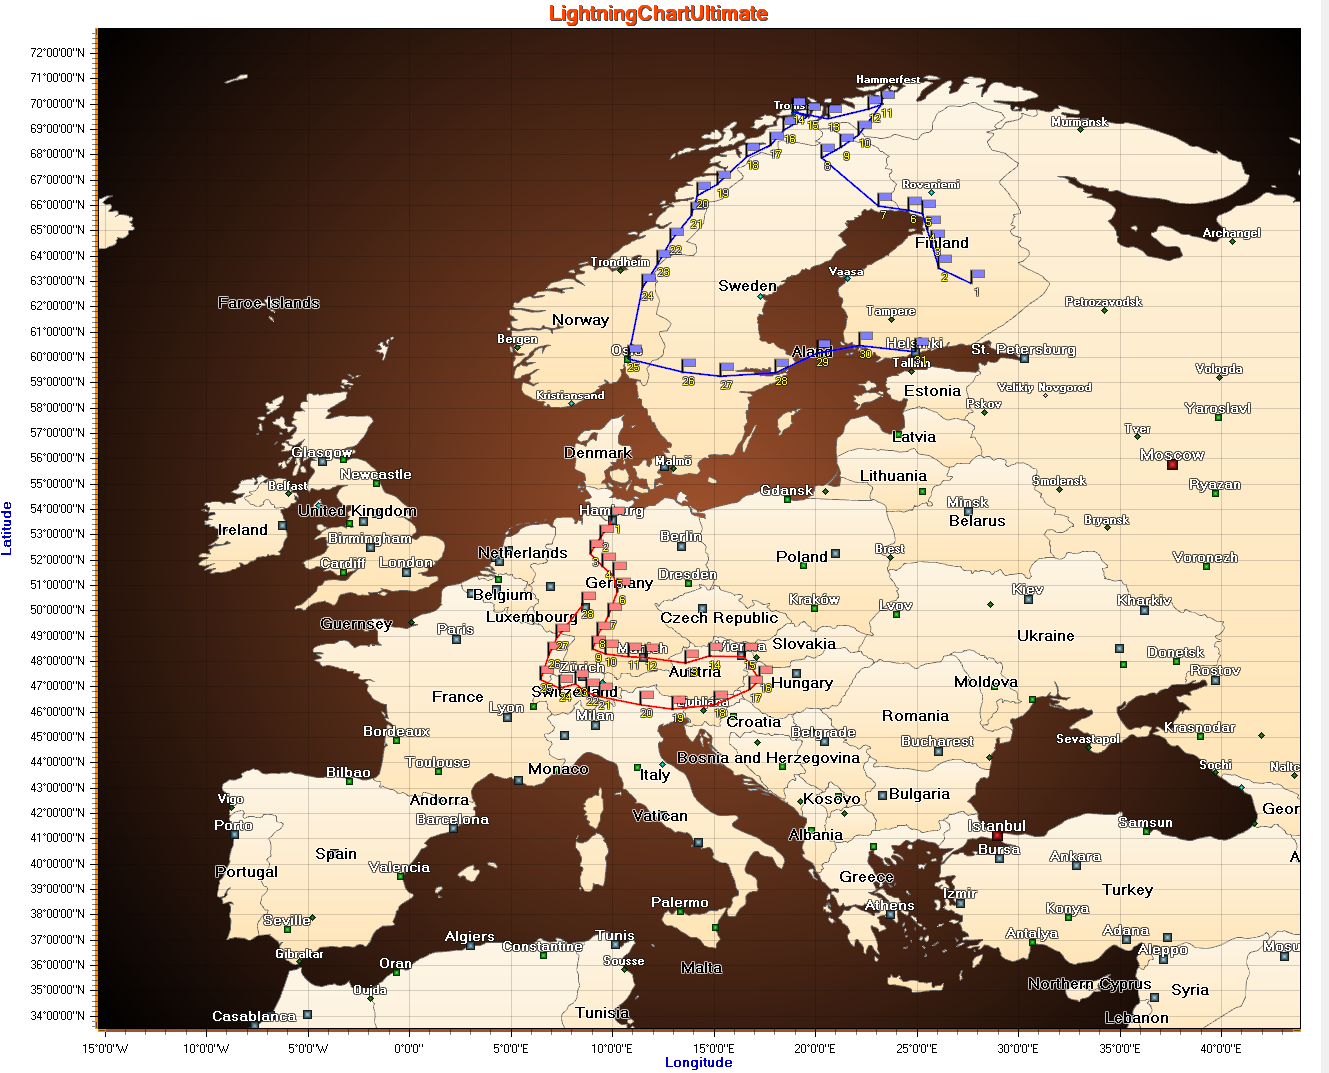
Map of Europe, with a couple of FreeformPointLine series as routes. Flag markers are added to them as mouse-interactive waypoints.
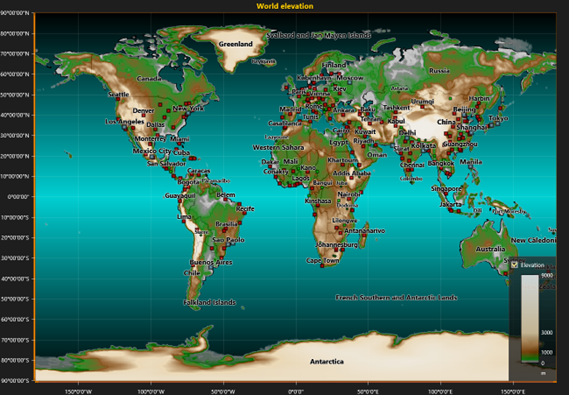
Map of the world, with IntensityGrid series presenting the elevation.
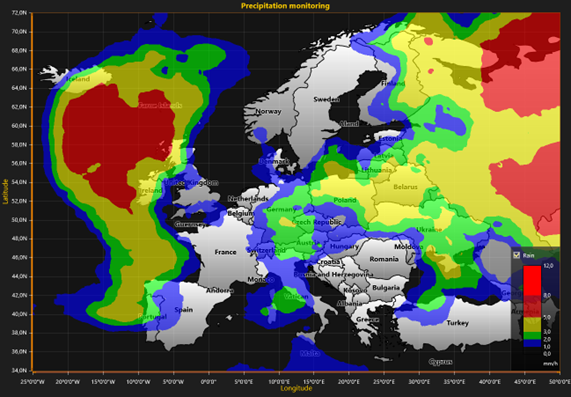
Weather radar data visualization with IntensityGrid series over the map of Europe
Examples
To see feature demonstration as example, check ExampleMaps, ExampleMapRoute, Map with environmental data, Wind data from our Demo.
Importing maps from ESRI shape file data
Import feature makes a LightningChart map file (.md) from .shp files. ESRI shapefile (*.shp) is a widely used map file format supporting vector and polygon data.
Map wizard can be used to convert shapefile data to LightningChart (LC) map data format. LC format supports layering, so multiple shapefiles can be merged into a single file. Map file structures and objects are pre-processed for maximum run-time performance.
LightningChart® .NET’s demo application has an example of map importing (ExampleMaps). Run import wizard from there to make custom LC map files through import.
Conversion is done in minimum of three steps:
- Selecting files and setting up layers based on the files in the Shapefile Selection Dialog.
- Determining file text encoding.
- Selecting items included in the resulting map file.
Note that steps 2 and 3 are repeated for each source shp file. Shapefile does not tell which encoding it uses, so it must be selected by the user.
After the steps, the conversion begins. If the maps are imported from a custom application, the developer is encouraged to setup an event handler, because conversion might take a very long time, so that user can be informed about the conversion progress.
Also, if user selects base layer, there might be a considerable delay between the steps, which is due to prefiltering data based on the layer.
Programming interface for importing shp data
Conversion is run on a thread that is initialized from Maps. MapConverter class using following method:
public bool SelectFilesAndConvert()
For monitoring conversion progress there is an event handler delegate:
public delegate void ConversionStateChangedEventHandler(Object sender, ConversionStateChangedEventArgs e);
Initializing it:
MapConverter mapConverter = new MapConverter(false);
mapConverter.ConversionStateChanged += mapConverter_ConversionStateChanged;
Dialogs
There are usually three dialogs involved in the conversion process. To select a filter, there is a distinct dialog.
Shapefile Selection Dialog
After SelectFilesAndConvert() function is called, file selection dialog opens. In this dialog user selects the source files and sets up the layering. User can also save the map configuration by selecting proper file at the dialog.
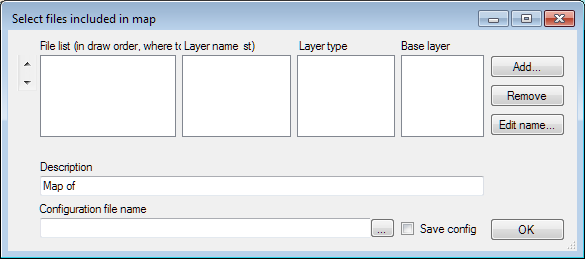
Source shape file selection dialog.
File list Contains list of files in the order in which they are drawn. File data at bottom is drawn last. Order of files can be chaged from the up/down buttons on the left of list. Select file and click up/down to move file.
Layer name Name of the layer. E.g. ”Countries”.
Layer type Type of layer (specifies which options are used to render layer)
- City: layer items are of shapefile type POINT
- Lake: layer items are of shapefile type POLYGON
- Land: layer items are of shapefile type POLYGON
- River: layer items are of shapefile type POLYLINE
Base layer Used to filter upper layer item selection, when user wants a map which contains only single/some countries and there is only global map available. E.g. if layer contains countries, only items over the selected countries/country will be included in the resulting map. There is a small offset applied to POINT type, so that if point is near enough of border it’s included even if it doesn’t overlap with base layer. If all data from the selected shapefiles are included in the resulting map, don’t select base layer as it slows down item selection considerably, because all items are checked if they overlap base layer, which is a very time consuming process.
Description Free text which is shown in the map properties.
Configuration file name XML configuration file name. Used for importing/replacing a layer. Note! Use single file when creating map configuration as import. Replace methods can take only one shp input file.
Save config Check this if wanting to save map configuration as xml file for later use. Selecting configuration file automatically sets this checked.
Add button Click to select shapefile to be added to list.
Remove button Removes selected file from list.
Edit name button Click to open ”Layer name editor”. Set layer name.
OK button Click to advance to next stage (item selection).
Select Record Encoding and Invalid Name Fields
This dialog is used to select file text encoding and fields which have invalid or general name. Shape file encoding may vary and there is no information about the encoding in the file, so user must select valid encoding. The item name may be like ”UNK” for multiple items. In this dialog the user can select which item name is emptied. Note that the items are still included in the resulting file, if they are selected in the next phase.
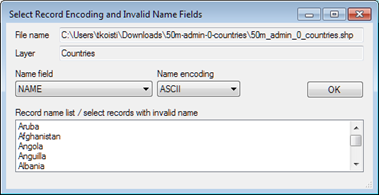
‘Record encoding’ and ‘Invalid name’ fields selection dialog
File name Shape file name for which the encoding applies.
Layer Layer name.
Name field Item name field in the shape file. After selecting a different field, the list is updated accordingly.
Name encoding Item name encoding (try different values if the name does not seem to be right). After selecting different encoding, the list is updated accordingly.
Record name list / select records with invalid name List of items for the field selected in the ”Name” field.
OK Confirm encoding selection (and possible invalid name).
Layer data selection dialog
This dialog is used to select items included in the resulting map file from the shape file. The layer name is concatenated in the title. The dialog is adaptive, so that for certain layers there are some fields which could be selected. E.g. for River/Road type layer there will be a Line width selection, which could be set to line width field (if applicable). Note that the data may not contain all the fields asked in the dialog. The Name field is mandatory for all items.
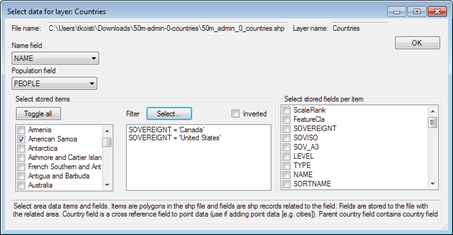
Layer data selection dialog.
The user interface items available in the dialog:
File name Name of the file.
Layer name Name of the layer.
Name field Field used for item name. Set automatically from encoding selection dialog but can be adjusted here also.
Population field Field used for population data.
Country field Country name field.
Line stroke width field Line width. Guides rendering of lines.
Select stored items Select items individually, select them all, or use Filter dialog to select subset of items
Toggle all Select all fields from file.
Filter/Select... Select fields which has a field with selected values. In the image above, only items with SOVEREIGNT field set to ”Canada” or ”United States” are selected in the map.
Inverted Invert filter selection (fields selected with filter are not included in resulting map file).
Select stored fields per item Click on fields which should be included for each item. The fields are key values for Dictionary class, which contains the fields per item.
Item filter
This dialog is opened from Layer data selection dialog and is used to filter items for resulting map.
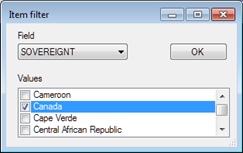
Item filter dialog.
Field Select the field on which the filtering is based.
Values Select values which are included in the resulting items.
The above selection means that items, whose field name SOVEREIGNT contains value ”Canada”, are included in the resulting map.
Importing and replacing map layers
User can import new layers to the map and replace existing layers. There are four methods for importing and replacing a layer in the map from Maps interface. This is very useful when retrieving frequently updated shp data while the software application is running.
ImportNewLayer methods inserts a new map layer to given layer index and ImportReplaceLayer methods replaces the map layer at the given layer index.
public MapConverter.ConversionResult ImportNewLayer(String shpFilename, int targetLayerIndex)
where shpFilename is the name of the source shp file name and targetLayerIndex is the index of the new layer. This method uses dialogs presented above for setting up map configuration.
public MapConverter.ConversionResult ImportNewLayer(String shpFilename, int targetLayerIndex, String configFile)
where shpFilename is the name of the source shp file name, targetLayerIndex is the index of the new layer and configFile is map configuration file name. This method uses configuration file created with dialogs presented above.
public MapConverter.ConversionResult ImportReplaceLayer(String shpFilename, int targetLayerIndex)
where shpFilename is the name of the source shp file name and targetLayerIndex is the index of the new layer. This method uses dialogs presented above for setting up map configuration.
public MapConverter.ConversionResult ImportReplaceLayer(String shpFilename, int targetLayerIndex, String configFile)
where shpFilename is the name of the source shp file name, targetLayerIndex is the index of the new layer and configFile is map configuration file name. This method uses configuration file created with dialogs presented above.
Configuration file is a plain xml file, which can be edited with a text editor, though editing is not recommended.
Tile maps
LightningChart has support for the following on-line tile data services:
- HERE: Street maps, Satellite imagery, Street night, Terrain Day and Terrain night. (Note, that night and terrain maps supported from v12.2 onwards)
LayerType
LightningChart supports tile data service by HERE.
Developer or end user must make an own contract with HERE to be able to use the HERE servers (free plan is also available). User needs to make own HERE API-Key in order for LightningChart tile-map feature will work. User can get one by following Readme document on HERE website.
By setting TileLayer. Type property user can chose between Street, Satellite or Terrain (topographic) type of imagery/maps. Street and Terrain map can be in day or night mode.
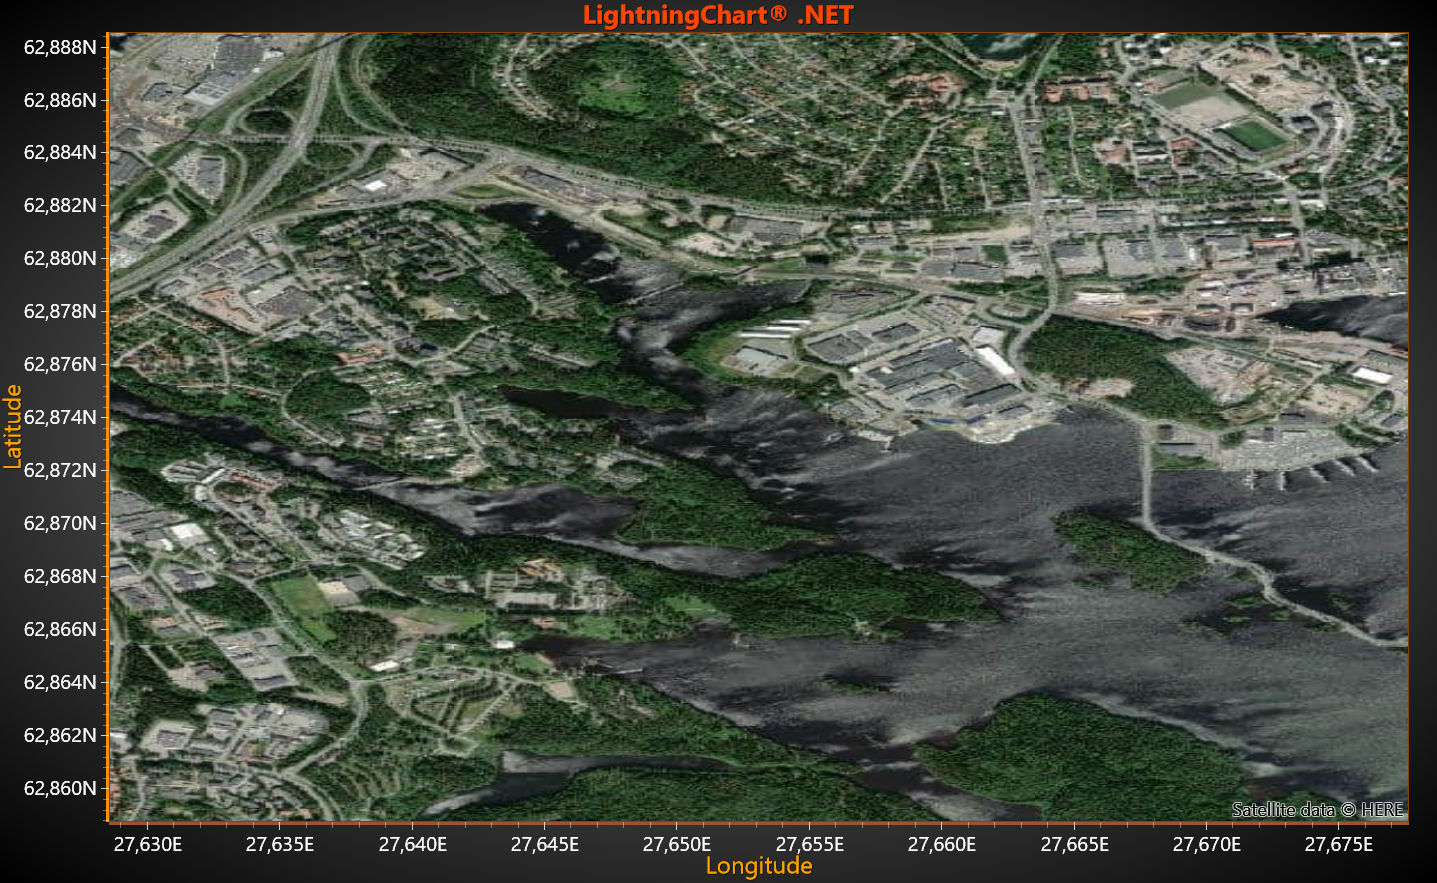
TileLayers[i].Type = TileLayer.LayerType.Satellite

TileLayers[i].Type = TileLayer.LayerType.Street

TileLayers[i].Type = TileLayer.LayerType.StreetNight

TileLayers[i].Type = TileLayer.LayerType.TerrainDay

TileLayers[i].Type = TileLayer.LayerType.TerrainNight
Presenting series and other chart elements, like annotations, is possible.
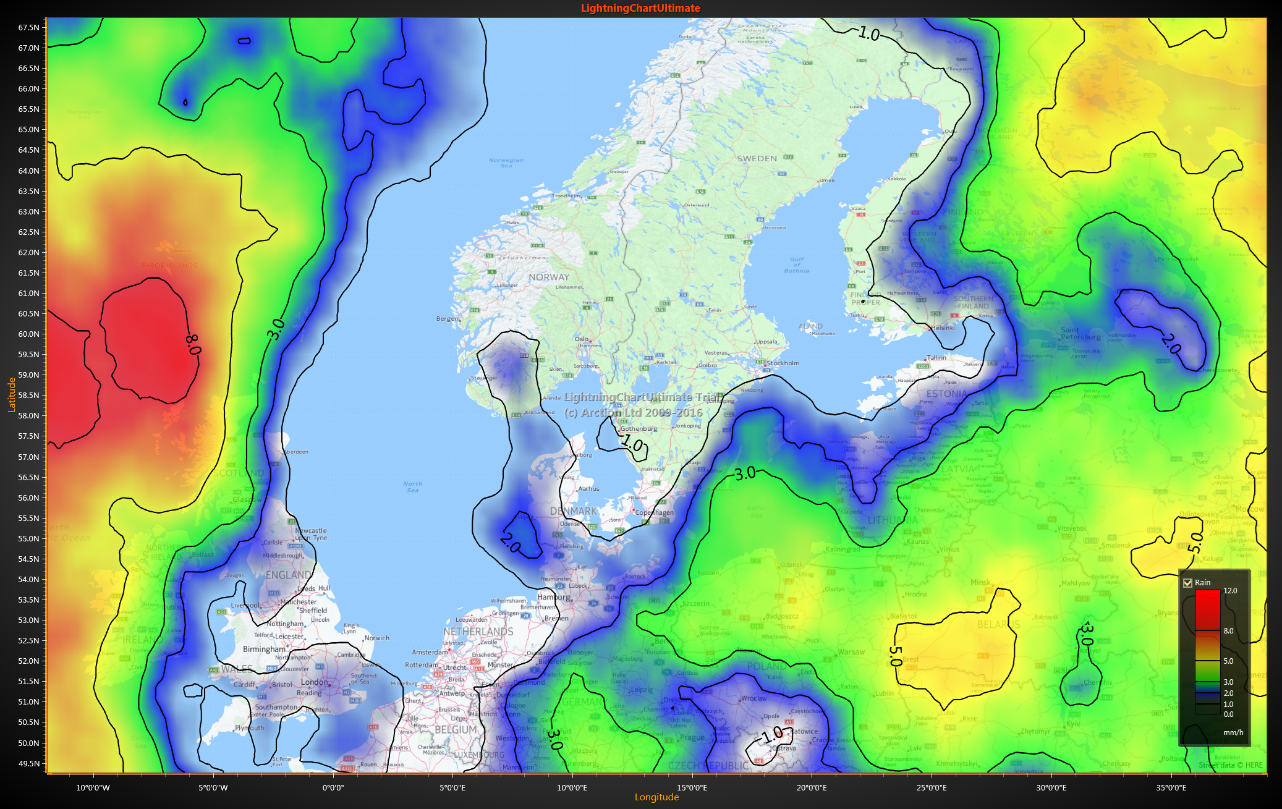
Street maps with IntensityGridSeries presenting weather data
TileLayer properties
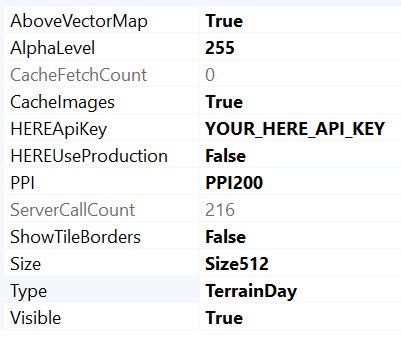
Properties of a TileLayer
Add TileLayer object(s) in ViewXY. Maps. TileLayers collection. Several layers can be inserted and made semi-transparent with AlphaLevel property. The TileLayer objects are rendered in the order of appearance in the TileLayers collection, the first layer being in the background. By setting AboveVectorMap = False, the layer renders before the vector map, if such are defined (see Vector maps). By default, the TileLayer renders after the vector maps.
TileLayer gets information as small images (i.e. tiles) from on-line service provider through http protocol and shows them in the chart area. The images are refreshed when zooming or panning the map view.
Loading a new set of tiles will take some time, up to several seconds.
Size and PPI
In LightningChart version 12.3.1 HERE map rendering services upgraded to use higher quality tile-images as default. In that library version also Size nad PPI properties are added to TileLayer. Size allows to select image size to be 256 or 512 (default). PPI property controls tile's PPI parameter to render labels and icons in different sizes. Available options are 100, 200 (default) or 400.
Tile cache
The chart stores the tiles into a cache folder, which greatly reduces the loading time when panning or zooming frequently in the same region. When the chart needs to show a tile, it first checks if it can be found in the cache folder, and if not, retrieves it from the web service. In a team use, where many workstations need to access the tile maps, it is wise to select a shared local network server folder. By default, the cache folder is c:\Users[Current user]\AppData\Local\Temp.
Set the cache folder in ViewXY.Maps.TileCacheFolder property.
Clear the cache folder by calling ViewXY.Maps.ClearTileCacheFolder() method.
To see feature demonstration as example, check HERE Maps streets, HERE Maps satellite from our Demo.