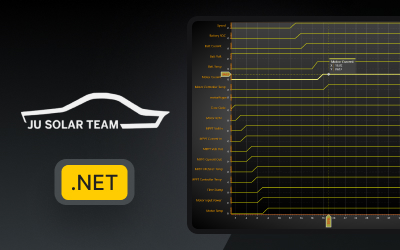
Date of case study: 06/2025 First collaboration: 01/2024 Industry of business: Automotive Established: 2013...


Regional Account & Marketing Executive (China, Japan and South Korea)
+358 503 543 706
Book a meeting
Regional Account Manager (North America, South America)
+358 505 528 995
Book a meetingOur dedicated sales team is ready to help you find the perfect solution for your data visualization needs. Don't hesitate to reach out for personalized assistance or to schedule a demo of our products.

Regional Account & Marketing Executive (China, Japan and South Korea)
+358 503 543 706
Book a meetingRegional Account Manager (North America, South America)
+358 505 528 995
Book a meetingOur dedicated sales team is ready to help you find the perfect solution for your data visualization needs. Don't hesitate to reach out for personalized assistance or to schedule a demo of our products.


Date of case study: 06/2025 First collaboration: 01/2024 Industry of business: Automotive Established: 2013...
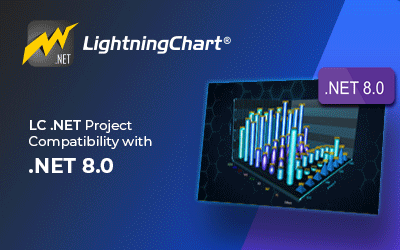
LightningChart .NET compatible with .NET 8.0 - video updateAn update on LightningChart .NET's compatibility with the...

Happy Holidays from It’s a been a very busy year for LightningChart, and we’d like to thank all the customers and...
The page you requested could not be found. Try refining your search, or use the navigation above to locate the post.